Regional Management Units for Marine Turtles: A Novel Framework for Prioritizing Conservation and Research across Multiple Scales
Bryan P. Wallace, Andrew D. DiMatteo, Brendan J. Hurley and 29 more
PLoS ONE · 2010
doi:10.1371/journal.pone.0015465 (opens in a new tab)
We email you when a new notice or a question about this paper appears.
Abstract
BACKGROUND: Resolving threats to widely distributed marine megafauna requires definition of the geographic distributions of both the threats as well as the population unit(s) of interest. In turn, because individual threats can operate on varying spatial scales, their impacts can affect different segments of a population of the same species. Therefore, integration of multiple tools and techniques--including site-based monitoring, genetic analyses, mark-recapture studies and telemetry--can facilitate robust definitions of population segments at multiple biological and spatial scales to address different management and research challenges. METHODOLOGY/PRINCIPAL FINDINGS: To address these issues for marine turtles, we collated all available studies on marine turtle biogeography, including nesting sites, population abundances and trends, population genetics, and satellite telemetry. We georeferenced this information to generate separate layers for nesting sites, genetic stocks, and core distributions of population segments of all marine turtle species. We then spatially integrated this information from fine- to coarse-spatial scales to develop nested envelope models, or Regional Management Units (RMUs), for marine turtles globally. CONCLUSIONS/SIGNIFICANCE: The RMU framework is a solution to the challenge of how to organize marine turtles into units of protection above the level of nesting populations, but below the level of species, within regional entities that might be on independent evolutionary trajectories. Among many potential applications, RMUs provide a framework for identifying data gaps, assessing high diversity areas for multiple species and genetic stocks, and evaluating conservation status of marine turtles. Furthermore, RMUs allow for identification of geographic barriers to gene flow, and can provide valuable guidance to marine spatial planning initiatives that integrate spatial distributions of protected species and human activities. In addition, the RMU framework--including maps and supporting metadata--will be an iterative, user-driven tool made publicly available in an online application for comments, improvements, download and analysis.
Full text
From PubMed Central, U.S. National Library of Medicine, as current on Oct 21, 2026. Paragraph numbers are ours, so an answer can point at one.
Introduction
Geospatial characterization of commercially important or conservation-dependent marine species provides crucial input for resource management in multi-use situations, as is currently described by ecosystem-based marine spatial planning. In particular, linking impacts of various threats to widely distributed marine megafauna populations (e.g. mammals, birds, turtles, sharks) requires description of overlaps between threats and the population segment of interest. Furthermore, widespread marine species often exhibit inter-population variation in life history traits and population dynamics that warrant population-specific management schemes,.
However, resolution of population units for conservation is not always straightforward, and requires clear understanding of conservation objectives, as well as the natural history of – and threats to – the species of interest. For example, evolutionarily significant units (ESUs) were first described to include sufficient genetic diversity to retain evolutionary potential, and thus address long-term conservation issues as well as historical population trends,. In contrast, population segments or management units (MUs) are functionally independent (i.e. exhibit distinct demographic processes), can be characterized using various tools or indicators, such as genetic markers, life history traits, behavior, or morphology, and are appropriate short-term targets for conservation. A major challenge to prioritization schemes arises when multiple population segments meet the criteria of a MU, each deserving specially designed conservation strategies.
Six of the seven marine turtle species are categorized as Vulnerable, Endangered, or Critically Endangered globally by the IUCN Red List of Threatened Species, but threats on regional scales can differentially affect life-stages of the same populations. Similar to other long-lived marine vertebrates, marine turtles occupy broad geographic ranges including separate breeding and feeding areas utilized by adults, and in some cases geographically distinct ontogenetic habitats for immature life stages, with different levels of population overlap at each stage. Furthermore, marine turtles have complex population structures characterized by female nesting site fidelity, male-mediated gene flow, and population overlap during migrations and in developmental habitats, with the degree of genetic population structuring increasing with life stages (see for review). Understanding the complex relationships among various nesting sites, nurseries, and foraging areas, particularly in the context of variation in environmental conditions, is crucial to quantifying population-level impacts of anthropogenic threats, as well as to designing effective conservation responses to these threats –. However, these complexities in population structures, habitat use, environmental factors, and life-stage-specific threats have confounded the definition of marine turtle MUs.
Molecular genetic analyses are often used to describe population structures and, by extension, to define MUs,,. Due to complex population structure and life history of marine turtles, different molecular analyses can be applied to determine genetic stock structure for different demographic segments of a population. Maternally inherited mitochondrial DNA (mtDNA) is useful for resolving nest site fidelity and homing behavior,. In addition to defining nesting populations (i.e. one level of MUs), this genetic marker is also useful for resolving maternal origin of both males and females at various life stages and feeding habitats.
Nesting females typically demonstrate philopatry to nesting areas, and both males and females can be philopatric to breeding areas adjacent to a nesting beach. However, males do not restrict mating efforts to their ancestral breeding area, and apparently copulate with females in coastal feeding habitat or migratory corridors as well, where they encounter females from other regional nesting populations. The result, registered in biparentally-inherited nuclear DNA (nDNA), is that regional nesting colonies are connected by this male-mediated gene flow, –. Because nDNA reflects contributions of both males and females, analyses of nDNA markers (e.g. microsatellites) can resolve breeding or reproductive stocks that encompass multiple mtDNA-defined nesting stocks,.
Genetic analyses clearly contribute to the resolution of MUs, but are not always sufficient for this purpose; such analyses can indicate that genetic population structure exists, but usually cannot resolve the boundaries of that structure,. Unique identifier tags applied to marine turtles at various life stages and in various habitats via mark-recapture monitoring programs can illuminate migration routes and connectivity of individual animals between habitats –. Furthermore, the advent of electronic tracking technology, specifically satellite telemetry and remote sensing, has facilitated an exponential increase in understanding of marine turtle movements, behaviors, biology, and conservation concerns (see for review). Therefore, integration of multiple tools and techniques, including site-based monitoring (e.g. nesting beaches, foraging areas), genetic analyses, mark-recapture studies, and telemetry, especially when supplemented with information on threats and influence of environmental conditions, can facilitate robust definitions of MUs for marine turtles at multiple scales to address different management and research challenges.
In response to these issues, we compiled, collated, and georeferenced available information on marine turtle biogeography – including individual nesting sites, genetic stocks, and geographic distributions based on monitoring research – to develop multi-scale Regional Management Units (RMUs). These RMUs spatially integrate sufficient information to account for complexities in marine turtle population structures, and thus provide a flexible, dynamic framework for evaluating threats, identifying high diversity areas, highlighting data gaps, and assessing conservation status of marine turtles.
Methods
The IUCN's Marine Turtle Specialist Group convened the Burning Issues Working Group (MTSG-BI) for two meetings (August 2008 and September 2009) of marine turtle experts from around the world who represented government agencies, non-governmental organizations, and academic institutions. The primary objective of these meetings was to develop a process for evaluating and prioritizing the conservation status of marine turtle populations worldwide. In this context, the MTSG-BI developed Regional Management Units (RMUs) as the framework for this evaluation and prioritization process.
To generate RMUs for marine turtles, we collated and georeferenced available data from more than 1,200 papers, reports, abstracts, and other sources (available for download at http://tinyurl.com/29w4kbf), extracting information on nesting sites, population genetics, tag returns, and satellite telemetry, as well as other relevant natural history and biogeography. We then spatially integrated this information in ArcMap 9.3 (ESRI, Redlands, CA USA) from fine (i.e. points with geographic coordinates for nesting sites) to coarse (i.e. polygon shapefiles for distributions) spatial scales. We constructed separate layers according to distinct biological/spatial scales, including a layer for nesting sites (i.e. individual nesting beaches), and two layers for genetic stocks (i.e. a layer each for maternally inherited mtDNA and biparentally inherited nDNA, respectively). Finally, all finer-scale levels were nested within the known core geographic distributions of these population units, according to satellite telemetry and tag return data. In this way, all nesting sites that were sampled and analyzed for genetic studies were represented within genetic stock layers, and defined genetic stocks were represented within RMU layers, such that information shared across scales was retained in each relevant layer. We also compiled available information on population sizes (i.e. annual numbers of nesting females) and trends (i.e. change in annual numbers of nesting females over time) at each spatial/biological scale. Although considerable uncertainty exists in estimates of population sizes and trends for marine turtles among sites globally, we did not attempt to standardize or improve estimates; we urge caution in interpretation of these metadata. This “nested envelope” approach allowed for metadata to be arranged within and across biologically defined spatial scales.
Nesting Sites
We defined a nesting site as a beach or beaches with confirmed marine turtle nesting activity monitored or analyzed as a singular site by the groups or individuals providing or publishing the nesting data. To compile and georeference nesting sites globally for all species, we used the State of the World's Sea Turtles – SWOT (www.seaturtlestatus.org) database, which relies on a global network of researchers who voluntarily contribute annual nesting data. We augmented the SWOT database with published information. We filtered all nesting sites to distinguish sites with confirmed, quantified nesting activity (i.e. counts) from those without quantified counts since 2000. Across species globally, we compiled more than 4,200 nesting sites, ranging from 30 for Kemp's ridleys (Lepidochelys kempii) to 1,337 for hawksbill turtles (Eretmochelys imbricata) (Table 1; Figs. 1, 2, 3, 4, 5, 6, 7, panel A). In accordance with data sharing protocols, metadata for SWOT nesting sites are not provided here. However, all SWOT nesting data can be viewed at http://seamap.env.duke.edu/swot, and a complete list of SWOT data providers is provided in Appendix S1.
Genetic Stocks
We compiled and georeferenced genetic stock information from available mtDNA and nDNA studies by constructing shapefiles that included all individual nesting sites upon which the genetic sampling and analyses were based. We identified 87 distinct mtDNA and 28 nDNA reported genetic stocks globally across marine turtle species (Table 1; Figs. 1, 2, 3, 4, 5, 6, 7, panels B and C; Appendix S2). While recognizing the diversity of analytical techniques – particularly the number and types of genetic markers, sample sizes, and statistical approaches – used to determine genetic stocks of marine turtles, we accepted genetic stock definitions as described by the original sources, rather than attempting to standardize or prioritize methodologies or interpretations. However, in cases where more recent studies clarified or contradicted earlier studies, we based our dataset on the results of the updated studies.
Regional Management Units
We generated polygons representing RMUs for all species of marine turtles, or geographically explicit population segments based on geographic boundaries to distributions derived from studies on genetics, tag returns, satellite telemetry, and other data (Figs. 1, 2, 3, 4, 5, 6, 7, panel D; Table S1; Appendix S2). RMUs were meant to encompass multiple nesting sites, mtDNA-defined nesting populations, and nDNA-defined breeding populations to reflect shared geographic distribution among conspecific marine turtles in the same region. Thus, RMUs do not represent complete geographic distributions of species on global or regional scales, but rather distributions that are anchored to landmasses by known nesting site(s) and/or genetic stock origins and defined by biogeographical information.
Specifically, we defined the boundaries of RMU polygons by generating termini directly from published satellite tracks, tag returns, or other data sources. These polygons were then digitized or imported into ArcGIS 9.3 either using the georeference tool in the ArcMap Toolbox, or based on text descriptions. In the absence of sufficient information, boundaries were further refined by MTSG experts. To allow clear distinctions between RMUs and complete global distributions, we also generated global distribution polygons for all species (Figs. 1, 2, 3, 4, 5, 6, 7, panel A; Appendix S2). These global distributions are coarse geographical representations of documented occurrence patterns – bounded by maximum extents – for each species. This process was generally similar to that used to generate species range maps for other taxonomic groups, such as those produced by the IUCN Red List of Threatened Species (http://www.iucnredlist.org/technical-documents/spatial-data). We acknowledge that this distinction means that RMU designations might not address threats occurring outside RMU boundaries but within the distribution of a species, but RMUs nonetheless encompass known core habitats and life stages. However, the important point is that whereas global distributions simply display broad geographic ranges for each species (including RMUs), the RMUs themselves provide refined spatial guidance for conservation strategies.
Olive ridley turtles (Lepidochelys olivacea) (along with their congener, Kemp's ridleys), are unique among marine turtles for their polymorphic nesting behavior; i.e. synchronous mass nesting at particular beaches (termed arribadas) and disperse, asynchronous or solitary nesting at the rest of the species' nesting beaches. Therefore, we established separate RMUs for arribadas and solitary nesters in regions where both behaviors occur (i.e. East Pacific Ocean, East Indian Ocean). Although the geographic boundaries of these RMUs are identical within a region, this dichotomy accurately reflects differences in population abundances and trends between the two behaviors.
In regions where nesting sites were known for certain species, but no other biological information (e.g. genetics or distributions) was available, we developed ‘putative RMUs’ so that no region-species combination was excluded. As with all RMUs, these putative RMUs will require modification as new information becomes available, but in the meantime, they represent obvious research and reporting priorities.
Results and Discussion
We identified 58 RMUs among the seven marine turtle species worldwide, ranging from a single RMU for Kemp's ridleys to 17 RMUs for green turtles (Chelonia mydas) (Figs. 1, 2, 3, 4, 5, 6, 7; Table S1, Appendix S2). The RMU framework is essentially a set of nested envelope models intended for multiple research and management applications. However, the efficacy of applications using RMUs depends on the accuracy and quality of the data contained in the files; data exist that we were unable to acquire and incorporate, and current designations of genetic stocks and geographic distributions are subject to change with new and improved analyses. For example, genetic analyses using new markers, larger sample sizes, and broader geographic sampling could reveal new or more nuanced stock structures, especially because insufficient sampling is always a major detractor to explanatory power of these analyses,,. Furthermore, because RMU boundaries are sometimes based on reports that contain relatively few localizations, some of which might be species misidentifications, improved data quality will help to resolve the geographic extents of RMUs.
Along these lines, because the metadata we compiled is derived from publicly available sources, the RMUs themselves will change with new, refined data. To facilitate iterative improvement of RMUs, we have made all map files (Figs. 1, 2, 3, 4, 5, 6, 7) and metadata associated with each layer (Appendix S2) available for comments and suggested edits, as well as download and analysis (in accordance with relevant data sharing protocols) by users within the OBIS-SEAMAP framework (Ocean Biogeographic Information System-Spatial Ecological Analysis of Megavertebrate Populations; http://seamap.env.duke.edu/swot). Thus, the applicability of RMUs to marine turtle conservation and research will be user-dependent, relying on collaboration among users in the community to maintain up-to-date, accurate files.
An important caveat inherent in the RMUs is that we are largely unable to differentiate between true absences (i.e. a species is not identified or is no longer present in an area despite thorough search effort) and absence due to lack of monitoring or reporting. Clearly, distributions of nesting sites and other types of information are biased by areas of high monitoring effort and reporting (e.g. Wider Caribbean region; ). In this vein, the maps and RMUs generally could be used in gap analyses to identify areas toward which enhanced census efforts should be directed in order to improve inter-regional comparisons of marine turtle distribution patterns. For example, the distribution of putative RMUs illustrates gaps in scientific understanding of marine turtle biogeography in much of the Indian Ocean, and biogeography of hawksbill turtles in particular (Figs. 1, 2, 3, 4, 5, 6, 7).
In addition to identifying data gaps, a major advantage of the RMU approach is the potential to connect impacts of particular threats to biologically relevant units and their associated demographic characteristics. For example, because marine turtle populations occur in terrestrial and marine habitats, the RMU tool provides the ability to overlay the geographic extent of not only nesting beach threats along a particular coastline (e.g. coastal development) to the particular marine turtle nesting sites and stocks that would be impacted, but also threats across a wider ocean area (e.g. fisheries bycatch) that could impact several nesting stocks and broader population units simultaneously. Furthermore, this system allows identification of spatial overlaps among RMUs – within and among species – which are important areas for conservation because threats impacting multiple RMUs might warrant different management attention than threats acting on a single RMU. Ultimately, although RMUs will not be equally valuable to conservation efforts in all regions, this framework is intended for setting conservation priorities at different levels of spatial and biological organization for marine turtles on a global scale. Below, we outline other potential applications of RMUs to marine turtle conservation and research.
Identification essential habitats for marine turtles
Characterization of heavily-utilized areas for marine turtles at different spatial scales is fundamental for creating effective conservation strategies, –. One straightforward application of RMUs is to identifying important geographic areas for marine turtle populations in terms of determination of presence, density, and richness. For example, geographic regions that host high densities of nesting sites, possibly of multiple species and/or genetic stocks, could merit investment of conservation resources. Demographic information included in the RMU metadata could also be incorporated in these evaluations to account for abundance and trends among sites and regions.
Likewise, areas of overlap among genetic stocks or geographic distributions, as well as regional variation in population trends at various spatial or biological scales could also be identified using RMUs. Although reproduction areas are relatively discrete geographically and genetically, foraging areas for marine turtles of all life stages host con-specific individuals from multiple stocks and geographic locations,,, –. Therefore, characterizing the connectivity among multiple nesting sites and multiple foraging areas – i.e. ‘many-to-many’ relationships – is necessary for holistically assessing demographic trends and conservation effectiveness,.
With this in mind, one next step for refining RMUs would be to expand on the genetic stocks based on nesting sites by spatially characterizing at-sea mixed-stock foraging or developmental areas,,,,. Moreover, weighting distribution layers according to a relative measure of proportional habitat use (e.g. kernel densities, home ranges) – incorporating both spatial and temporal information – to distinguish among high-use areas and fringe habitats would be another useful extension of the RMU framework. Although incorporating and mapping this information would be challenging given data currently available in published research studies, this step would dramatically improve the ability of RMUs to facilitate identification of marine turtle habitats in relation to other georeferenced information of threats or environmental factors.
Improved definition of genetic stock distributions
Despite the emphasis on genetic resolution of MUs, reliance on population structure derived from such analyses can be inadequate for management,. Failure to detect population units with genetic markers does not necessarily mean that no management-relevant structuring exists. For example, a newly colonized nesting beach might host turtles that are genetically indistinguishable from the parent (source) population, yet the new nesting cohort is geographically isolated from the parent population. These limitations highlight the need for alternative types of information to make informed MU designations.
Along these lines, several studies have proposed or identified geographic or environmental barriers to migration of marine turtles among nesting sites or foraging areas that appear to result in significant population (but not necessarily genetic) differentiation. The distance between nesting sites that results in isolated nesting stocks appears to vary within, and among species,. Based on identification of 17 distinct green turtle genetic stocks among 27 nesting sites sampled in Australasia, Dethmers et al. proposed that nesting sites separated by more than 500 km are likely to host isolated nesting populations; in contrast, undifferentiated leatherback (Dermochelys coriacea) genetic stocks span thousands of kilometers of coastlines within geographic regions. Furthermore, recent studies have described spatial distributions of genetic stocks in foraging and developmental areas at-sea based on local and regional ocean current patterns in the Wider Caribbean,, Atlantic Ocean, Mediterranean Sea, and Pacific Ocean,.
Although barriers to gene flow have not been defined in most cases, these studies illustrate geographic and environmental influences on marine turtle population structures that can be tested within the RMU framework, because nesting sites as well as known genetic stocks are georeferenced. Thus, by applying oceanographic or other physical information as well as relatively simple distance buffering analyses to the RMU files, researchers can test hypotheses about spatial distributions of genetic stocks within and across geographic regions. Resulting distributions of population segments would allow more flexibility in defining MUs than those derived solely from quantitative analyses of genetic differentiation, and would also provide clear objectives for further analyses.
Conservation status assessments
Evaluation of species or population status, including population sizes and trends, as well as threats and relevant biological information, is a prerequisite for prioritizing conservation resources. However, because defining the relevant biological or geographic scale at which to conduct assessments and make recommendations is always a fundamental question in these processes, RMUs are a valuable resource to guide how populations of marine turtle species are assessed.
For example, the IUCN Red List of Threatened Species represents the only globally accepted system for evaluating extinction risk for species, but the IUCN/SSC Marine Turtle Specialist Group (MTSG) has debated the utility and validity of a global classification system for marine turtles, and has advocated for regional assessments (see for review). A survey of MTSG members from 23 countries revealed that nearly 90% of respondents believed that regional assessments should use either ‘new MTSG criteria’ or ‘flexible, non-standardized criteria’. However, there was less consensus among members about the appropriate population segment upon which to base regional assessments, with nearly 50% of respondents stating “by geographic region,” ∼30% stating “by genetic stocks,” and ∼20% stating “by nesting sites,” illustrating the challenges inherent in defining management units for marine turtles. Utilizing the RMU framework – which contains information at each of those spatial and biological scales – within or in conjunction with the Red List assessment process could address some of the controversy within the MTSG regarding the application of a single global listing for geographically variable marine turtle species by providing regional units for assessment,.
Another example of incorporating population differences in conservation status assessments is the listing process under the U.S. Endangered Species Act (ESA). The ESA provides for designation and listing of Distinct Population Segments (DPS) of a species based on ‘discreteness’ and ‘significance’ of that segment,. In a recent Biological Review of loggerhead turtles (Caretta caretta) for purposes of evaluating the species' current Threatened listing status on ESA, nine DPSs were defined, with distinct recommendations for each DPS. Not surprisingly, the process by which DPSs are defined is very similar to that used to define RMUs, as both depend on biogeographical information from genetics, distribution, movements, and demographics. There was nearly complete agreement between the loggerhead DPSs and our RMU designations; the two schemes essentially differed only in how putative RMUs are handled (Table 1). This result provides further support for the validity of the RMU framework for intra-specific conservation assessments.
It is important to note that in geographic regions where there are existing systems for effectively identifying marine turtle population segments to which to target conservation efforts, such as well-defined breeding populations in eastern Australia,,, –, RMUs will be of limited utility. In contrast, RMUs will be most appropriately applied to areas hosting several populations or stocks, possibly of multiple species, especially in regions with relatively little available information. Thus, RMUs are designed to be coarse yet flexible enough to be applicable anywhere in the world, rather than being restricted to areas with the best available information, but can be refined in the future when new information becomes available.
Marine spatial planning and applications to similar species with complex life histories
To optimize ecosystem function, especially in areas where multiple activities by multiple nations occur, ecosystem-based marine management approaches should be designed to preserve marine biodiversity, keystone species, and biological connectivity among marine habitats,. Thus, detailed characterizations of distributions and natural histories of key species (e.g. keystones, top predators, ecosystem engineers) are instrumental to guiding exercises in marine spatial planning.
RMUs provide explicit, ecologically based spatial and demographic information about geographic distributions of marine turtle populations that could be integrated with other georeferenced layers, including human activities subject to management (e.g. fisheries operations, hydrocarbon extraction, coastal development, shipping, etc.). Furthermore, the RMU concept could be applied easily to multi-scale biogeographical characterization of other marine megafauna species with similar life history traits and broad, complex distributions. As with marine turtles, identification of high-use habitats, connectivity between breeding and feeding areas, as well as overlapping distributions of distinct populations is extremely important for designing appropriate management schemes for these species –.
Conclusions
The novel RMU framework synthesizes available biogeographical information on globally distributed and imperiled marine turtles into a multi-scaled, geospatial tool for which we envision numerous pertinent applications for marine turtle conservation and research. For example, the MTSG Burning Issues Working Group is utilizing RMUs as the basis for status assessments in a developing process of global conservation priority setting for marine turtles. The RMU classification system is consistent with endangered species laws in the United States and elsewhere, and could provide the IUCN-MTSG with a way forward for regional evaluations of extinction risk.
Although species are predominantly used as the currency for evaluating and prioritizing conservation efforts (e.g. IUCN Red List, Alliance for Zero Extinction, Conservation ‘Hotspots’), in the case of globally distributed species like marine turtles, regional population segments occupy distinct ecological roles and thus merit conservation attention, because extinction of an RMU would represent the loss of the species' ecological role within an entire region and ecosystems therein. By defining populations according to ecological characteristics, the RMU approach implies the inherent importance of each RMU as an independent conservation unit, which species-focused conservation approaches might fail to recognize.
We emphasize that the resolution of RMUs does not detract from the treatment of nesting populations as management units. Abundant historical, mark-recapture, and genetic data indicate that nesting populations will rise and fall as independent demographic units. The value of RMUs is in the recognition of regional groupings of marine turtles that overlap in feeding and nursery habitats, exchange genetic material, and face common threats at sea. Therefore, the RMU framework is a solution to the challenge of how to organize marine turtles into units of protection above the level of nesting populations, but below the level of species, within regional entities that might be on independent evolutionary trajectories. Finally, the RMU system is neither static nor proprietary, but rather is iterative and user-driven. We encourage broad and creative engagement with and application of this tool, whose long-term accuracy and efficacy will rely on updates, edits, and improvements arising from user interactions.
Figures7
From PubMed Central, U.S. National Library of Medicine.
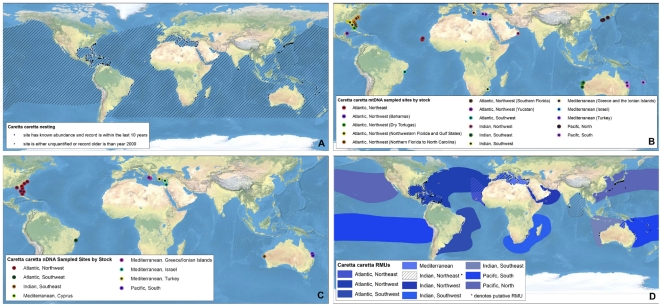
Figure 1
Full legend
Multi-scale Regional Management Units for loggerhead turtles Caretta caretta. Individual maps are presented for A) global nesting sites and in-water distributions (global distributions for each species represented by hatching); B) mitochondrial (mtDNA) genetic stocks; C) nuclear genetic (nDNA) stocks; and D) Regional Management Units (shown with nesting sites). Nesting sites that were unquantified or have no count values reported since 2000 are represented by black squares, whereas nesting sites for which count data are available are represented by a colored circle. For genetic stock maps (Figs. 1B and C), each symbol represents a different site that was sampled for genetic analyses, while each color represents a distinct genetic stock. Putative RMUs (see text for description) are noted by asterisks in the figure legends, and are colorless. Data shown are contained in metadata tables (Appendix S2).
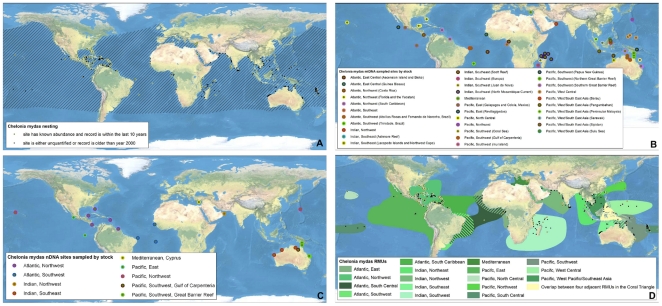
Figure 2
Full legend
Multi-scale Regional Management Units for green turtles Chelonia mydas. Individual maps are presented for A) global nesting sites and in-water distributions (global distributions for each species represented by hatching); B) mitochondrial (mtDNA) genetic stocks; C) nuclear genetic (nDNA) stocks; and D) Regional Management Units (shown with nesting sites). Nesting sites that were unquantified or have no count values reported since 2000 are represented by black squares, whereas nesting sites for which count data are available are represented by a colored circle. For genetic stock maps (Figs. 2B and C), each symbol represents a different site that was sampled for genetic analyses, while each color represents a distinct genetic stock. Data shown are contained in metadata tables (Appendix S2).
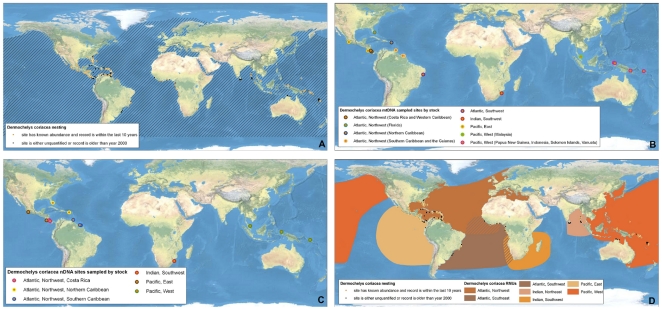
Figure 3
Full legend
Multi-scale Regional Management Units for leatherback turtles Dermochelys coriacea. Individual maps are presented for A) global nesting sites and in-water distributions (global distributions for each species represented by hatching); B) mitochondrial (mtDNA) genetic stocks; C) nuclear genetic (nDNA) stocks; and D) Regional Management Units (shown with nesting sites). Nesting sites that were unquantified or have no count values reported since 2000 are represented by black squares, whereas nesting sites for which count data are available are represented by a colored circle. For genetic stock maps (Figs. 3B and C), each symbol represents a different site that was sampled for genetic analyses, while each color represents a distinct genetic stock. Data shown are contained in metadata tables (Appendix S2).
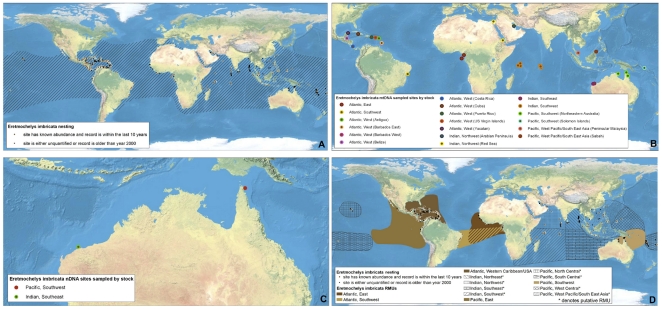
Figure 4
Full legend
Multi-scale Regional Management Units for hawksbill turtles Eretmochelys imbricata. Individual maps are presented for A) global nesting sites and in-water distributions (global distributions for each species represented by hatching); B) mitochondrial (mtDNA) genetic stocks; C) nuclear genetic (nDNA) stocks; and D) Regional Management Units (shown with nesting sites). Nesting sites that were unquantified or have no count values reported since 2000 are represented by black squares, whereas nesting sites for which count data are available are represented by a colored circle. For genetic stock maps (Figs. 4B and C), each symbol represents a different site that was sampled for genetic analyses, while each color represents a distinct genetic stock. Putative RMUs (see text for description) are noted by asterisks in the figure legends, and are colorless. Data shown are contained in metadata tables (Appendix S2).
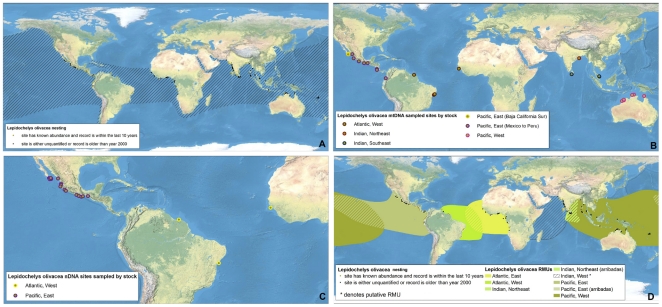
Figure 5
Full legend
Multi-scale Regional Management Units for olive ridley turtles Lepidochelys olivacea. Individual maps are presented for A) global nesting sites and in-water distributions (global distributions for each species represented by hatching); B) mitochondrial (mtDNA) genetic stocks; C) nuclear genetic (nDNA) stocks; and D) Regional Management Units (shown with nesting sites). Nesting sites that were unquantified or have no count values reported since 2000 are represented by black squares, whereas nesting sites for which count data are available are represented by a colored circle. For genetic stock maps (Figs. 5B and C), each symbol represents a different site that was sampled for genetic analyses, while each color represents a distinct genetic stock. Putative RMUs (see text for description) are noted by asterisks in the figure legends, and are colorless. Data shown are contained in metadata tables (Appendix S2).
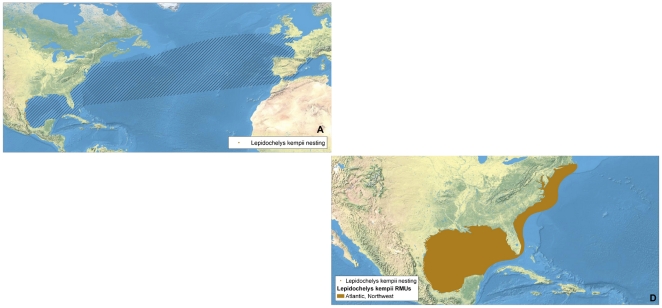
Figure 6
Full legend
Multi-scale Regional Management Units for Kemp's ridley turtles Lepidochelys kempii. Individual maps are presented for A) global nesting sites and in-water distributions (global distributions for each species represented by hatching); and D) Regional Management Units (shown with nesting sites). Nesting sites that were unquantified or have no count values reported since 2000 are represented by black squares, whereas nesting sites for which count data are available are represented by a colored circle. Putative RMUs (see text for description) are noted by asterisks in the figure legends, and are colorless. Note: There are no genetics maps (Panels B or C) for L. kempii because all individuals are presumed to belong to same stock and RMU. Data shown are contained in metadata tables (Appendix S2).
Show all 7 figures
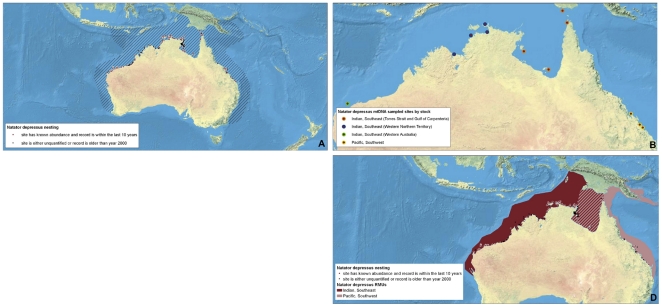
Figure 7
Full legend
Multi-scale Regional Management Units for flatback turtles Natator depressus. Individual maps are presented for A) global nesting sites and in-water distributions (global distributions for each species represented by hatching); B) mitochondrial (mtDNA) genetic stocks; and D) Regional Management Units (shown with nesting sites). Nesting sites that were unquantified or have no count values reported since 2000 are represented by black squares, whereas nesting sites for which count data are available are represented by a colored circle. For genetic stock maps (Fig. 7B), each symbol represents a different site that was sampled for genetic analyses, while each color represents a distinct genetic stock. Note: There is no map for N. depressus nDNA stocks (panel C, due to lack of available data). Data shown are contained in metadata tables (Appendix S2).
References59
- 1.
Foley MM, Halpern BS, Micheli F, Armsby MH, Caldwell MR, et al. Guiding ecological principles for marine spatial planning. Mar Pol. 2010;34:955-966.
Not in our library
- 2.
Bowen BW, Bass AL, Soares L, Toonen RJ. Conservation implications of complex population structure: lessons from the loggerhead turtle (Caretta caretta). Mol Ecol. 2005;14:2389-2402.
Not in our library10.1111/j.1365-294x.2005.02598.x (opens in a new tab)
- 3.
Suryan RM, Saba VS, Wallace BP, Hatch SA, Frederiksen M, et al. Environmental forcing on life history strategies: Multi-trophic level response at ocean basin scales. Prog Oceanogr. 2009;81:214-218.
Not in our library
- 4.
Taylor BL, Dizon AE. First policy then science: why a management unit based solely on genetic criteria cannot work. Mol Ecol. 1999;8:S11-S16.
Not in our library10.1046/j.1365-294x.1999.00797.x (opens in a new tab)
- 5.
Moritz C. Defining ‘evolutionary significant units’ for conservation. Trends in Ecology & Evolution. 1994;9:373-375.
Not in our library10.1016/0169-5347(94)90057-4 (opens in a new tab)
- 6.
Ashley MV, Willson MF, Pergams ORW, O'Dowd DJ, Gende SM, et al. Evolutionarily enlightened management. Biol Conserv. 2003;111:1150-123.
Not in our library
- 7.
IUCN Red List of Threatened Species. 2010.
Not in our library
- 8.
Musick JA, Limpus CJ, Lutz PL, Musick JA. Habitat utilization and migration in juvenile sea turtles. The Biology of Sea Turtles. 1997;137-164.
Not in our library
- 9.
Bowen BW, Karl SA. Population genetics and phylogeography of sea turtles. Mol Ecol. 2007;16:4886-4907.
Not in our library10.1111/j.1365-294x.2007.03542.x (opens in a new tab)
- 10.
Bolker BM, Okuyama T, Bjorndal KA, Bolten AB. Incorporating multiple mixed stocks in mixed stock analysis: ‘many-to-many’ analyses. Mol Ecol. 2007;16:68-695.
Not in our library10.1111/j.1365-294x.2006.03161.x (opens in a new tab)
- 11.
Wallace BP, Saba VS. Environmental and anthropogenic impacts on intra-specific variation in leatherback turtles: opportunities for targeted research and conservation Endangered Species Research. 2009;7:1-11.
Not in our library
- 12.
Hamann M, Godfrey MH, Seminoff JA, Arthur K, Barata PCR, et al. Global research priorities for sea turtles: informing management and conservation in the 21st century. Endangered Species Research. 2010;11:245-269.
Not in our library
- 13.
Dethmers KEM, Broderick D, Moritz C, FitzSimmons NN, Limpus CJ, et al. The genetic structure of Australasian green turtles (Chelonia mydas): exploring the geographical scale of genetic exchange. Mol Ecol. 2006;15:3931-3946.
Not in our library10.1111/j.1365-294x.2006.03070.x (opens in a new tab)
- 14.
Meylan AB, Bowen BW, Avise JC. A genetic test of the natal homing versus social facilitation models for green turtle migration. Science. 1990;248:724-727.
Not in our library10.1126/science.2333522 (opens in a new tab)
- 15.
Bowen BW, Bass AL, Chow S-M, Bostrom M, Bjorndal KA, et al. Natal homing in juvenile loggerhead turtles (Caretta caretta). Mol Ecol. 2004;13:3797-3808.
Not in our library10.1111/j.1365-294x.2004.02356.x (opens in a new tab)
- 16.
- 17.
Karl SA, Bowen BW, Avise JC. Global population genetic structure and male-mediated gene flow in the green turtle (Chelonia mydas): RFLP analyses of anonymous nuclear loci. Genetics. 1992;131:163-173.
Not in our library10.1093/genetics/131.1.163 (opens in a new tab)
- 18.
FitzSimmons NN, Moritz C, Limpus CJ, Pope L, Prince R. Geographic structure of mitochondrial and nuclear gene polymorphisms in Australian green turtle populations and male-biased gene flow. Genetics. 1997b;147:1843-1854.
Not in our library10.1093/genetics/147.4.1843 (opens in a new tab)
- 19.
Carreras C, Pascual M, Cardona LM, Aguilar A, Margaritoulis D, et al. The genetic structure of the loggerhead sea turtle (Caretta caretta) in the Mediterranean as revealed by nuclear and mitochondrial DNA and its conservation implications. Cons Gen. 2007;8:761-775.
Not in our library
- 20.
Martien KK, Taylor BT. Limitations of hypothesis-testing in defining management units for continuously distributed species. J Cet Res Manag. 2003;5:213-218.
Not in our library
- 21.
Limpus CJ, Miller JD, Parmenter CJ, Reimer D, McLachlan N, et al. Migration of green (Chelonia mydas) and loggerhead (Caretta caretta) turtles to and from eastern Australian rookeries. Wildlife Res. 1992;19:347-358.
Not in our library
- 22.
Limpus CJ, Miller JD, Parmenter CJ, Limpus DJ. The green turtle, Chelonia mydas, population of Raine Island and the Northern Great Barrier Reef: 1843-2001. Memoirs Queensland Museum. 2003;49:349-440.
Not in our library
- 23.
Limpus CJ. A biological review of Australian Marine turtles: Green turtle Chelonia mydas (Linnaeus), Queensland Environmental Protection Agency,. 2008;96.
Not in our library
- 24.
Godley BJ, Blumenthal JM, Broderick AC, Coyne MS, Godfrey MH, et al. Satellite tracking of sea turtles: Where have we been and where do we go next? Endangered Species Research. 2008;4:3-22.
Not in our library
- 25.
Godley BJ, Barbosa C, Bruford M, Broderick AC, Catry P, et al. Unravelling migratory connectivity in marine turtles using multiple methods. J Appl Ecol. 2010.
Not in our library
- 26.
Abreu-Grobois FA, Plotkin PT. IUCN Red List Status Assessment of the olive ridley sea turtle (Lepidochelys olivacea). IUCN/SSC-Marine Turtle Specialist Group,. 2007;39.
Not in our library
- 27.
Formia A, Broderick AC, Glen F, Godley BJ, Hays GC, et al. Genetic composition of the Ascension Island green turtle rookery based on mitochondrial DNA: implications for sampling and diversity. Endangered Species Research. 2007;3:145-158.
Not in our library
- 28.
Blumenthal JM, Abreu-Grobois FA, Austin TJ, Broderick AC, Bruford MW, et al. Turtle groups or turtle soup: dispersal patterns of hawksbill turtles in the Caribbean. Mol Ecol. 2009;18:4841-4853.
Not in our library10.1111/j.1365-294x.2009.04403.x (opens in a new tab)
- 29.
Frazier J. Misidentifications of sea turtles in the East Pacific: Caretta caretta and Lepidochelys olivacea. J Herp. 1985;19:1-11.
Not in our library
- 30.
Halpin PN, Read AJ, Fujioka E, Best BD, Donnelly B, et al. OBIS-SEAMAP The World Data Center for Marine Mammal, Sea Bird, and Sea Turtle Distributions. Oceanography. 2009;22:104-115.
Not in our library
- 31.
Dow W, Eckert KL, Palmer M, Kramer P. An Atlas of Sea Turtle Nesting Habitat for the Wider Caribbean Region. The Wider Caribbean Sea Turtle Conservation Network and The Nature Conservancy. WIDECAST Technical Report No. 6,. 2007;267.
Not in our library
- 32.
Dryden J, Grech A, Moloney J, Hamann M. Re-zoning of the Great Barrier Reef World Heritage Area: does it afford greater protection for marine turtles? Wildlife Res. 2008;35:477-485.
Not in our library
- 33.
Witt MJ, Broderick AC, Coyne MS, Formia A, Ngouessono S, et al. Satellite tracking highlights difficulties in the design of effective protected areas for Critically Endangered leatherback turtles Dermochelys coriacea during the inter-nesting period. Oryx. 2008;42:296-300.
Not in our library
- 34.
Shillinger GL, Palacios DM, Bailey H, Bograd SJ, Swithenbank AM, et al. Persistent leatherback turtle migrations present opportunities for conservation. PLoS Biol. 2008;6:e171.
Not in our library10.1371/journal.pbio.0060171 (opens in a new tab)
- 35.
Bolten AB, Bjorndal KA, Martins HR, Dellinger T, Biscoito MJ, et al. Transatlantic development migrations of loggerhead sea turtles demonstrated by mtDNA sequence analysis. Ecol App. 1998;8:1-7.
Not in our library
- 36.
Lahanas PN, Bjorndal K, Bolten A, Encalada SE, Miyamoto MM, et al. Genetic composition of a green turtle (Chelonia mydas) feeding ground population: evidence for multiple origins. Mar Biol. 1998;130:345-352.
Not in our library
- 37.
Bass AL, Epperly SP, Braun-McNeill J. Green turtle (Chelonia mydas) foraging and nesting aggregations in the Caribbean and Atlantic: impact of currents and behavior on dispersal. J Hered. 2006;97:346-354.
Not in our library10.1093/jhered/esl004 (opens in a new tab)
- 38.
Bjorndal K, Bolten A. Annual variation in source contributions to a mixed stock: implications for quantifying connectivity. Mol Ecol. 2008;17:2185-2193.
Not in our library10.1111/j.1365-294x.2008.03752.x (opens in a new tab)
- 39.
Bjorndal KA, Bolten AB, Troeng S. Population structure and genetic diversity in green turtles nesting at Tortuguero, Costa Rica, based on mitochondrial DNA control region sequences. Mar Biol. 2005;147:1449-1457.
Not in our library
- 40.
Monzon-Arguello C, Lopez-Jurado L, Rico C, Marco A, Lopez P, Hays G, Lee P. Evidence from gnetic and Lagrangian drifter data for transatlantic transport of small juvenile green turtles. J Biogeogr. 2010;37:1752-1766.
Not in our library
Cited by papers we hold9
Seeing Red: Inside the Science and Politics of the IUCN Red List · 2012
Not checked
Reads
Read by people on this page
None yet.
Checked or read by AI through naulon
None yet.
A person counts once a day per paper. We keep no cookie and no address: a reader is a hash that changes every day. Any month under five reads shows no number.
Are you an author?
Is this your paper?
Claim it to add your note and be paid when agents cite it. Free.