Inference of Population Splits and Mixtures from Genome-Wide Allele Frequency Data
Joseph K. Pickrell, Jonathan K. Pritchard
PLoS Genetics · 2012
doi:10.1371/journal.pgen.1002967 (opens in a new tab)
We email you when a new notice or a question about this paper appears.
Abstract
Many aspects of the historical relationships between populations in a species are reflected in genetic data. Inferring these relationships from genetic data, however, remains a challenging task. In this paper, we present a statistical model for inferring the patterns of population splits and mixtures in multiple populations. In our model, the sampled populations in a species are related to their common ancestor through a graph of ancestral populations. Using genome-wide allele frequency data and a Gaussian approximation to genetic drift, we infer the structure of this graph. We applied this method to a set of 55 human populations and a set of 82 dog breeds and wild canids. In both species, we show that a simple bifurcating tree does not fully describe the data; in contrast, we infer many migration events. While some of the migration events that we find have been detected previously, many have not. For example, in the human data, we infer that Cambodians trace approximately 16% of their ancestry to a population ancestral to other extant East Asian populations. In the dog data, we infer that both the boxer and basenji trace a considerable fraction of their ancestry (9% and 25%, respectively) to wolves subsequent to domestication and that East Asian toy breeds (the Shih Tzu and the Pekingese) result from admixture between modern toy breeds and "ancient" Asian breeds. Software implementing the model described here, called TreeMix, is available at http://treemix.googlecode.com.
No text here
Its licence does not allow us to show the full text. Read it at PubMed Central:
Read at PubMed Central (opens in a new tab)Figures6
From PubMed Central, U.S. National Library of Medicine.
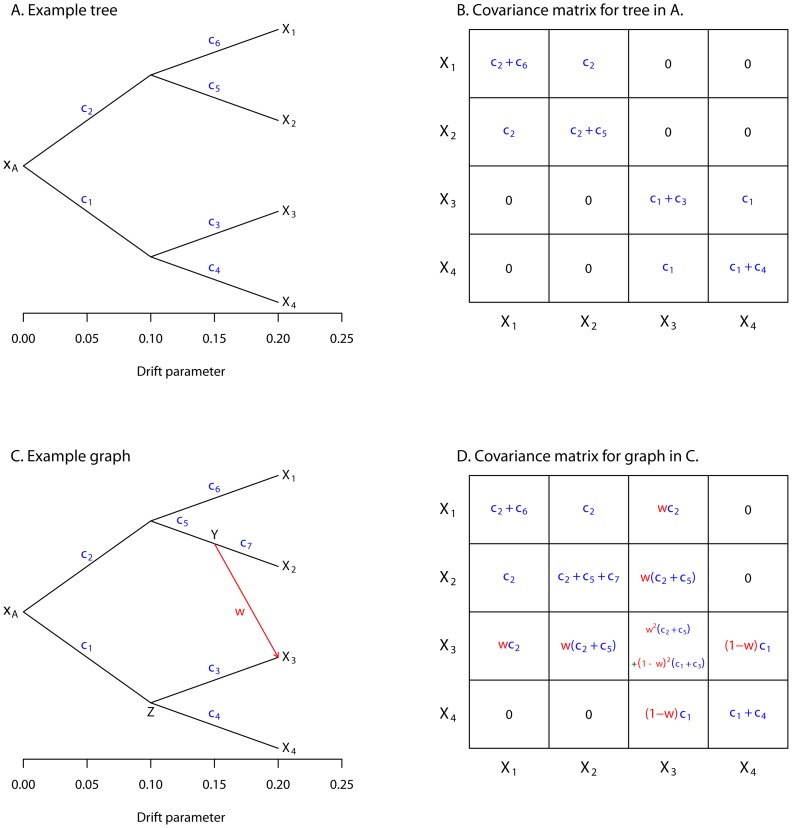
Figure 1
Full legend
Simple examples. A. An example tree. B. The covariance matrix implied by the tree structure in A. Note that the covariance here is with respect to the allele frequency at the root, and that each entry has been divided by to simplify the presentation. C. An example graph. The migration edge is colored red. Parental populations for population 3 are labeled and; see the main text for details. D. The covariance matrix implied by the graph in C; again, each entry has been divided by. The migration terms are in red, and the non-migration terms are in blue.
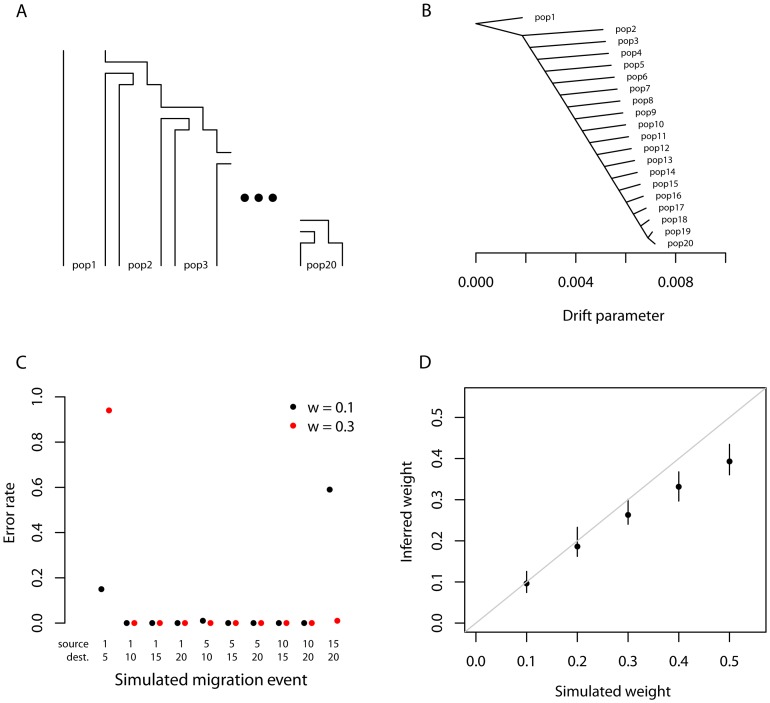
Figure 2
Full legend
Performance on simulated data. A. The basic outline of the demographic model used. B. Trees inferred by TreeMix. We simulated 100 independent data sets, under the demographic model in A., and inferred the tree. All simulations gave the same topology; plotted are the mean branch lengths. C. Performance in the presence of migration. We added migration events to the tree in A. and inferred the structure of the graph. Each point represents the error rate over 100 independent simulations, defined as the fraction of simulations where the inferred graph topology does not perfectly match the simulated topology. On the x-axis we show the populations involved in the simulated migration event; e.g., if the source population is 1 and the destination population is 10, this is a migration event from population 1 to population 10, as labeled in A. D. Admixture weight estimation. We simulated admixture events with different weights from population 1 to population 10, and inferred the weight. Each point is the mean across 100 simulations, and the bar represents the range.
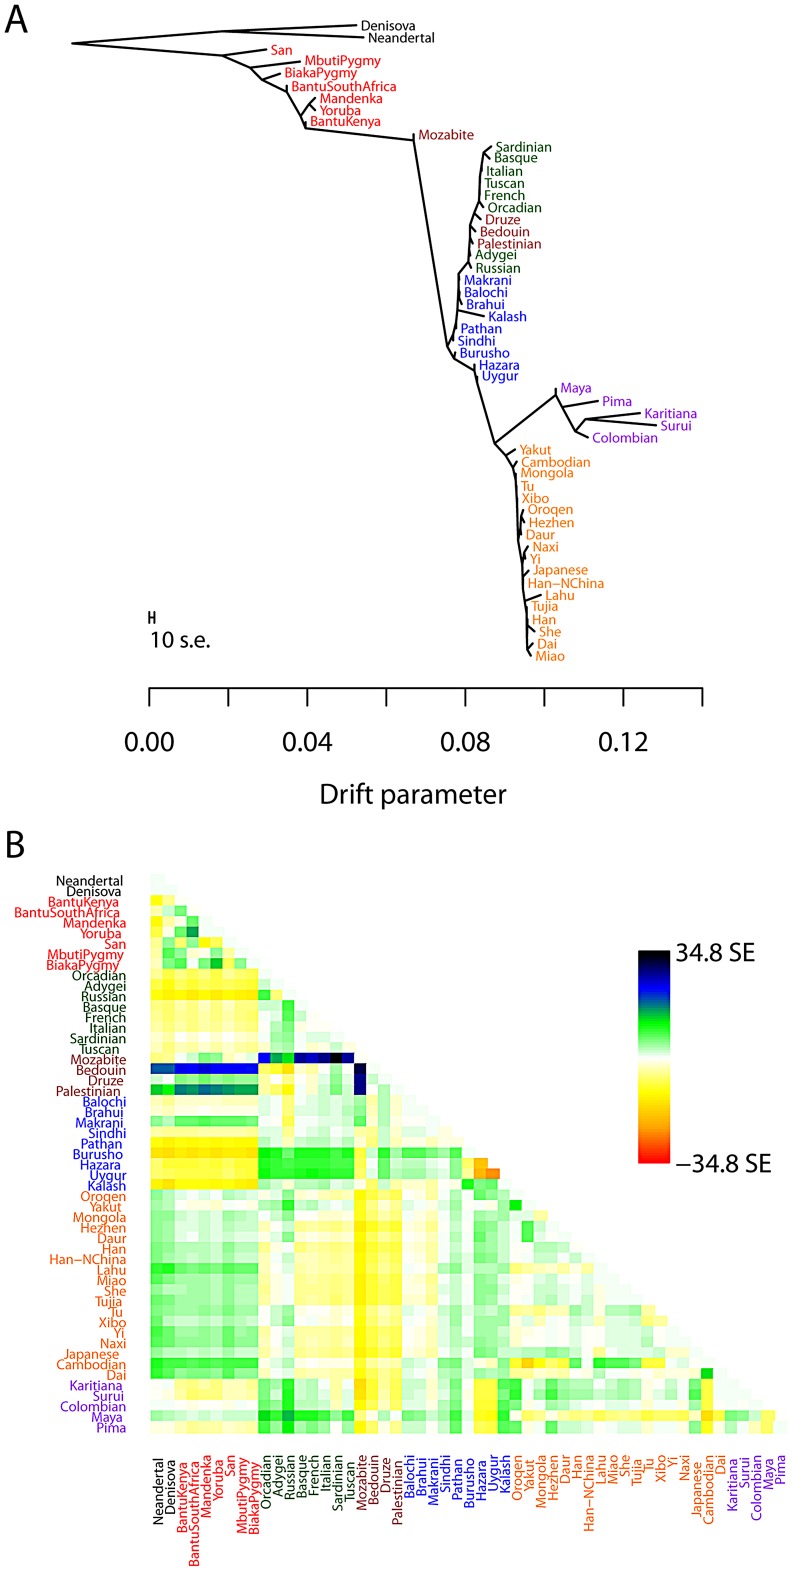
Figure 3
Full legend
Inferred human tree. A. Maximum likelihood tree. Plotted is the maximum-likelihood tree. Populations are colored according to geographic location (black: archaic humans, red: Africa, brown: Middle East, green: Europe, blue: Central Asia, purple: America, orange: East Asia). The scale bar shows ten times the average standard error of the entries in the sample covariance matrix (). For analysis including Oceania, see Figures S11 and S12. B. Residual fit. Plotted is the residual fit from the maximum likelihood tree in A. We divided the residual covariance between each pair of populations and by the average standard error across all pairs. We then plot in each cell this scaled residual. Colors are described in the palette on the right. Residuals above zero represent populations that are more closely related to each other in the data than in the best-fit tree, and thus are candidates for admixture events.
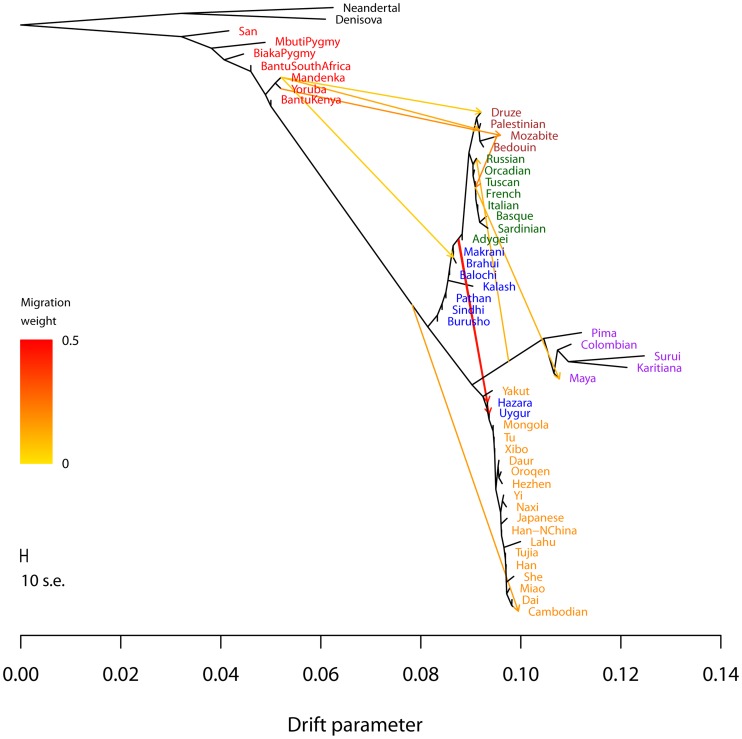
Figure 4
Full legend
Inferred human tree with mixture events. Plotted is the structure of the graph inferred by TreeMix for human populations, allowing ten migration events. Migration arrows are colored according to their weight. Horizontal branch lengths are proportional to the amount of genetic drift that has occurred on the branch. The scale bar shows ten times the average standard error of the entries in the sample covariance matrix (). The residual fit from this graph is shown in Figure S9. Admixture from Neandertals to non-African populations is only apparent when considering subsets of the data (see Discussion and Figure S15).
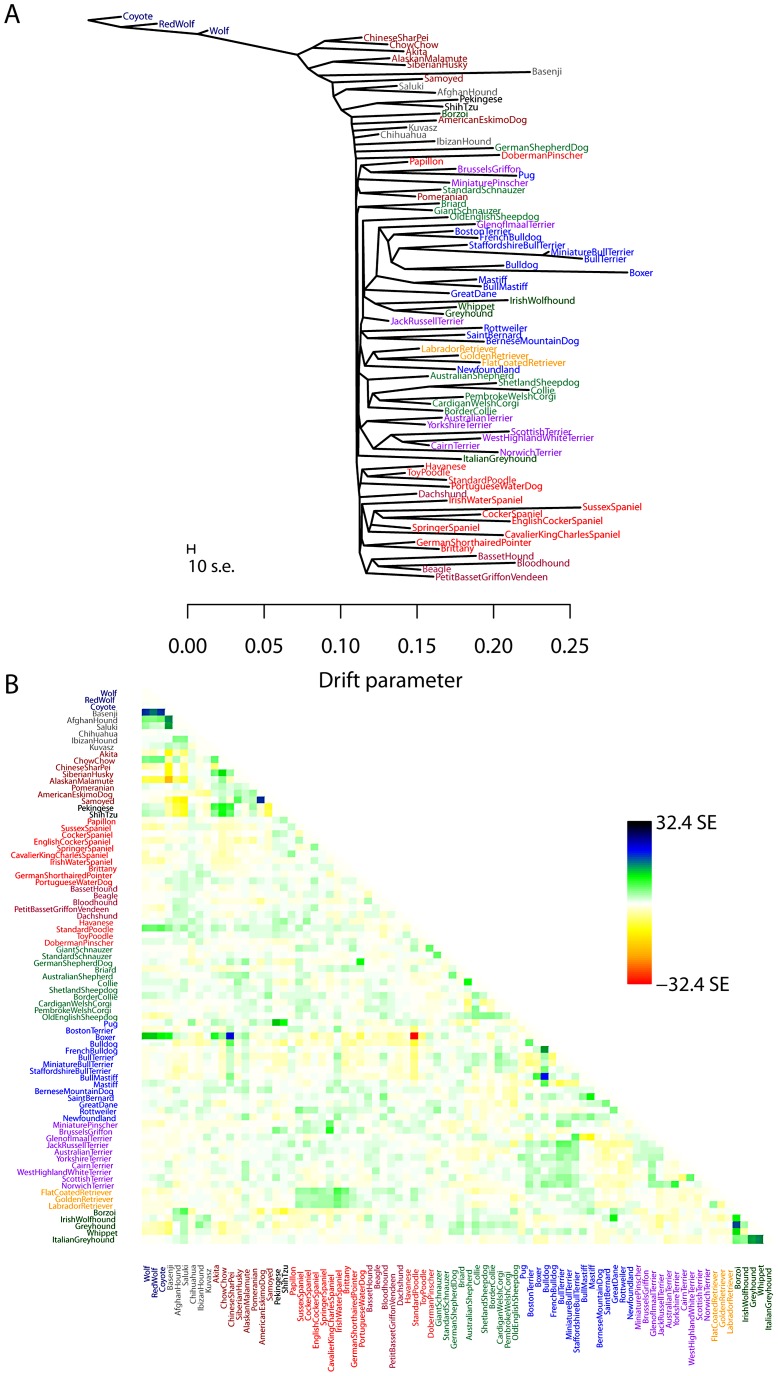
Figure 5
Full legend
Inferred dog tree. A. Maximum likelihood tree. Populations are colored according to breed type. Dark blue: wild canids, grey: ancient breeds, brown: spitz breeds, black: toy dogs, red: spaniels, maroon: scent hounds, dark red: working dogs, light green: herding dogs, light blue: mastiff-like dogs, purple: small terriers, orange: retrievers, dark green: sight hounds. The scale bar shows ten times the average standard error of the entries in the sample covariance matrix (). B. Residual fit. Plotted is the residual fit from the maximum likelihood tree in A. We divided the residual covariance between each pair of populations and by the average standard error across all pairs. We then plot in each cell this scaled residual. Colors are described in the palette on the right.
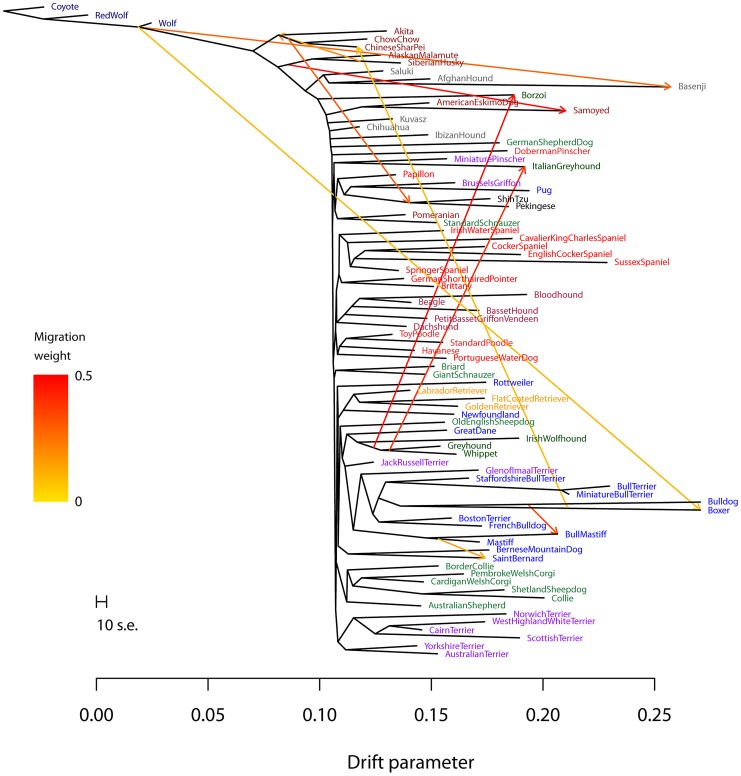
Figure 6
Full legend
Inferred dog graph. Plotted is the structure of the graph inferred by TreeMix for dog populations, allowing ten migration events. Migration arrows are colored according to their weight. The scale bar shows ten times the average standard error of the entries in the sample covariance matrix (). See the main text for discussion. The residual fit from this graph is presented in Figure S13.
References70
- 1.
Cavalli-Sforza LL, Edwards AW (1967 ) Phylogenetic analysis. Models and estimation proce-dures. Am J Hum Genet 19: 233–57.
Not in our library
- 2.
Felsenstein J (1982 ) How can we infer geography and history from gene frequencies? J Theor Biol 96: 9–20.
Not in our library10.1016/0022-5193(82)90152-7 (opens in a new tab)
- 3.
Cann RL, Stoneking M, Wilson AC (1987 ) Mitochondrial DNA and human evolution. Nature 325: 31–6.
Not in our library10.1038/325031a0 (opens in a new tab)
- 4.
Nei M, Roychoudhury AK (1974 ) Genic variation within and between the three major races of man, Caucasoids, Negroids, and Mongoloids. Am J Hum Genet 26: 421–43.
Not in our library
- 5.
Nei M, Roychoudhury AK (1993 ) Evolutionary relationships of human populations on a global scale. Mol Biol Evol 10: 927–43.
Not in our library10.1093/oxfordjournals.molbev.a040059 (opens in a new tab)
- 6.
Cavalli-Sforza LL, Piazza A, Menozzi P, Mountain J (1988 ) Reconstruction of human evolution: bringing together genetic, archaeological, and linguistic data. Proc Natl Acad Sci U S A 85: 6002–6.
Not in our library10.1073/pnas.85.16.6002 (opens in a new tab)
- 7.
Li JZ, Absher DM, Tang H, Southwick AM, Casto AM, et al (2008 ) Worldwide human rela-tionships inferred from genome-wide patterns of variation. Science 319: 1100–1104.
Not in our library10.1126/science.1153717 (opens in a new tab)
- 8.
Pritchard JK, Seielstad MT, Perez-Lezaun A, Feldman MW (1999 ) Population growth of human Y chromosomes: a study of Y chromosome microsatellites. Mol Biol Evol 16: 1791–8.
Not in our library10.1093/oxfordjournals.molbev.a026091 (opens in a new tab)
- 9.
Beaumont MA, Zhang W, Balding DJ (2002 ) Approximate Bayesian computation in popula-tion genetics. Genetics 162: 2025–35.
Not in our library10.1093/genetics/162.4.2025 (opens in a new tab)
- 10.
Schaffner SF, Foo C, Gabriel S, Reich D, Daly MJ, et al (2005 ) Calibrating a coalescent simulation of human genome sequence variation. Genome Res 15: 1576–1583.
Not in our library10.1101/gr.3709305 (opens in a new tab)
- 11.
- 12.
Hey J, Nielsen R (2004 ) Multilocus methods for estimating population sizes, migration rates and divergence time, with applications to the divergence of Drosophila pseudoobscura and D. persimilis. Genetics 167: 747–60.
Not in our library10.1534/genetics.103.024182 (opens in a new tab)
- 13.
Beerli P, Felsenstein J (1999 ) Maximum-likelihood estimation of migration rates and effective population numbers in two populations using a coalescent approach. Genetics 152: 763–73.
Not in our library10.1093/genetics/152.2.763 (opens in a new tab)
- 14.
Becquet C, Przeworski M (2007 ) A new approach to estimate parameters of speciation models with application to apes. Genome Res 17: 1505–19.
Not in our library10.1101/gr.6409707 (opens in a new tab)
- 15.
Kubatko LS (2009 ) Identifying hybridization events in the presence of coalescence via model selection. Syst Biol 58: 478–88.
Not in our library10.1093/sysbio/syp055 (opens in a new tab)
- 16.
Gronau I, Hubisz MJ, Gulko B, Danko CG, Siepel A (2011 ) Bayesian inference of ancient human demography from individual genome sequences. Nat Genet 43: 1031–4.
Not in our library10.1038/ng.937 (opens in a new tab)
- 17.
Menozzi P, Piazza A, Cavalli-Sforza L (1978 ) Synthetic maps of human gene frequencies in Europeans. Science 201: 786–92.
Not in our library10.1126/science.356262 (opens in a new tab)
- 18.
Pritchard JK, Stephens M, Donnelly P (2000 ) Inference of population structure using multi-locus genotype data. Genetics 155: 945–59.
Not in our library10.1093/genetics/155.2.945 (opens in a new tab)
- 19.
- 20.
- 21.
Rosenberg NA, Pritchard JK, Weber JL, Cann HM, Kidd KK, et al (2002 ) Genetic structure of human populations. Science 298: 2381–2385.
Not in our library10.1126/science.1078311 (opens in a new tab)
- 22.
Liti G, Carter DM, Moses AM, Warringer J, Parts L, et al (2009 ) Population genomics of domestic and wild yeasts. Nature 458: 337–41.
Not in our library10.1038/nature07743 (opens in a new tab)
- 23.
vonHoldt BM, Pollinger JP, Lohmueller KE, Han E, Parker HG, et al (2010 ) Genome-wide SNP and haplotype analyses reveal a rich history underlying dog domestication. Nature 464: 898–902.
Not in our library10.1038/nature08837 (opens in a new tab)
- 24.
François O, Currat M, Ray N, Han E, Excoffier L, et al (2010 ) Principal component analysis under population genetic models of range expansion and admixture. Mol Biol Evol 27: 1257–68.
Not in our library10.1093/molbev/msq010 (opens in a new tab)
- 25.
- 26.
Novembre J, Stephens M (2008 ) Interpreting principal component analyses of spatial popula-tion genetic variation. Nat Genet 40: 646–9.
Not in our library10.1038/ng.139 (opens in a new tab)
- 27.
Saitou N, Nei M (1987 ) The neighbor-joining method: a new method for reconstructing phy-logenetic trees. Mol Biol Evol 4: 406–25.
Not in our library10.1093/oxfordjournals.molbev.a040454 (opens in a new tab)
- 28.
Felsenstein J (1973 ) Maximum-likelihood estimation of evolutionary trees from continuous characters. Am J Hum Genet 25: 471–92.
Not in our library
- 29.
RoyChoudhury A, Felsenstein J, Thompson EA (2008 ) A two-stage pruning algorithm for likelihood computation for a population tree. Genetics 180: 1095–105.
Not in our library10.1534/genetics.107.085753 (opens in a new tab)
- 30.
Felsenstein J (1981 ) Evolutionary trees from gene frequencies and quantitative characters: finding maximum likelihood estimates. Evolution 35: 1229–1242.
Not in our library10.1111/j.1558-5646.1981.tb04991.x (opens in a new tab)
- 31.
Sirén J, Marttinen P, Corander J (2011 ) Reconstructing population histories from single nu-cleotide polymorphism data. Mol Biol Evol 28: 673–83.
Not in our library10.1093/molbev/msq236 (opens in a new tab)
- 32.
Nielsen R, Mountain JL, Huelsenbeck JP, Slatkin M (1998 ) Maximum-likelihood estimation of population divergence times and population phylogeny in models without mutation. Evolution 52: 669–677.
Not in our library10.1111/j.1558-5646.1998.tb03692.x (opens in a new tab)
- 33.
Nicholson G, Smith AV, Jónsson F, Gústafsson Ó, Stefánsson K, et al (2002 ) Assessing Pop-ulation Differentiation and Isolation from Single-Nucleotide Polymorphism Data. Journal of the Royal Statistical Society Series B (Statistical Methodology) 64: 695–715.
Not in our library
- 34.
Cavalli-Sforza LL (1973 ) Analytic review: some current problems of human population genet-ics. Am J Hum Genet 25: 82–104.
Not in our library
- 35.
Cavalli-Sforza LL, Piazza A (1975 ) Analysis of evolution: evolutionary rates, independence and treeness. Theor Popul Biol 8: 127–65.
Not in our library10.1016/0040-5809(75)90029-5 (opens in a new tab)
- 36.
Keinan A, Mullikin JC, Patterson N, Reich D (2007 ) Measurement of the human allele fre-quency spectrum demonstrates greater genetic drift in East Asians than in Europeans. Nat Genet 39: 1251–5.
Not in our library10.1038/ng2116 (opens in a new tab)
- 37.
Reich D, Thangaraj K, Patterson N, Price AL, Singh L (2009 ) Reconstructing Indian popula-tion history. Nature 461: 489–94.
Not in our library10.1038/nature08365 (opens in a new tab)
- 38.
Durand EY, Patterson N, Reich D, Slatkin M (2011 ) Testing for Ancient Admixture between Closely Related Populations. Mol Biol Evol 28: 2239–52.
Not in our library10.1093/molbev/msr048 (opens in a new tab)
- 39.
Green RE, Krause J, Briggs AW, Maricic T, Stenzel U, et al (2010 ) A draft sequence of the Neandertal genome. Science 328: 710–22.
Not in our library10.1126/science.1188021 (opens in a new tab)
- 40.
Lathrop GM (1982 ) Evolutionary trees and admixture: phylogenetic inference when some populations are hybridized. Ann Hum Genet 46: 245–55.
Not in our library10.1111/j.1469-1809.1982.tb00716.x (opens in a new tab)
- 41.
Reich D, Green RE, Kircher M, Krause J, Patterson N, et al (2010 ) Genetic history of an archaic hominin group from Denisova Cave in Siberia. Nature 468: 1053–60.
Not in our library10.1038/nature09710 (opens in a new tab)
- 42.
Reich D, Patterson N, Kircher M, Delfin F, Nandineni MR, et al (2011 ) Denisova admixture and the first modern human dispersals into Southeast Asia and Oceania. Am J Hum Genet 89: 516–28.
Not in our library10.1016/j.ajhg.2011.09.005 (opens in a new tab)
- 43.
- 44.
Rasmussen M, Guo X, Wang Y, Lohmueller KE, Rasmussen S, et al (2011 ) An Aboriginal Australian genome reveals separate human dispersals into Asia. Science 334: 94–8.
Not in our library10.1126/science.1211177 (opens in a new tab)
- 45.
Huson D, Rupp R, Scornavacca C (2010) Phylogenetic Networks. Concepts, Algorithms and Applications. Cambridge University Press.
Not in our library
- 46.
Huson DH, Bryant D (2006 ) Application of phylogenetic networks in evolutionary studies. Mol Biol Evol 23: 254–67.
Not in our library10.1093/molbev/msj030 (opens in a new tab)
- 47.
Dyer RJ, Nason JD (2004 ) Population Graphs: the graph theoretic shape of genetic structure. Mol Ecol 13: 1713–27.
Not in our library10.1111/j.1365-294x.2004.02177.x (opens in a new tab)
- 48.
Coop G, Witonsky D, Di Rienzo A, Pritchard JK (2010 ) Using environmental correlations to identify loci underlying local adaptation. Genetics 185: 1411–23.
Not in our library10.1534/genetics.110.114819 (opens in a new tab)
- 49.
Weir BS, Hill WG (2002 ) Estimating F-statistics. Annu Rev Genet 36: 721–50.
Not in our library10.1146/annurev.genet.36.050802.093940 (opens in a new tab)
- 50.
Felsenstein J (2003) Inferring Phylogenies. Sinauer Associates, 2nd edition.
Not in our library
- 51.
DeGiorgio M, Jakobsson M, Rosenberg NA (2009 ) Out of Africa: modern humanorigins special feature: explaining worldwide patterns of human genetic variation using a coalescent- based serial founder model of migration outward from Africa. Proc Natl Acad Sci U S A 106: 16057–62.
Not in our library10.1073/pnas.0903341106 (opens in a new tab)
- 52.
Jakobsson M, Scholz SW, Scheet P, Gibbs JR, VanLiere JM, et al (2008 ) Genotype, haplotype and copy-number variation in worldwide human populations. Nature 451: 998–1003.
Not in our library10.1038/nature06742 (opens in a new tab)
- 53.
Hellenthal G, Auton A, Falush D (2008 ) Inferring human colonization history using a copying model. PLoS Genet 4: e1000078 doi:10.1371/journal.pgen.1000078..
Not in our library10.1371/journal.pgen.1000078 (opens in a new tab)
- 54.
Patterson N, Moorjani P, Luo Y, Mallick S, Rohland N, et al (2012 ) Ancient admixture. Genetics In Press.
Not in our library10.1534/genetics.112.145037 (opens in a new tab)
- 55.
- 56.
Xu S, Huang W, Qian J, Jin L (2008 ) Analysis of genomic admixture in Uyghur and its implication in mapping strategy. Am J Hum Genet 82: 883–94.
Not in our library10.1016/j.ajhg.2008.01.017 (opens in a new tab)
- 57.
- 58.
- 59.
American Kennel Club (2006) The complete dog book. Ballantine Books.
Not in our library
- 60.
Parker HG, Kim LV, Sutter NB, Carlson S, Lorentzen TD, et al (2004 ) Genetic structure of the purebred domestic dog. Science 304: 1160–4.
Not in our library10.1126/science.1097406 (opens in a new tab)
- 61.
Novembre J, Johnson T, Bryc K, Kutalik Z, Boyko AR, et al (2008 ) Genes mirror geography within Europe. Nature 456: 98–101.
Not in our library10.1038/nature07331 (opens in a new tab)
- 62.
Novembre J, Ramachandran S (2011 ) Perspectives on human population structure at the cusp of the sequencing era. Annu Rev Genomics Hum Genet 12: 245–74.
Not in our library10.1146/annurev-genom-090810-183123 (opens in a new tab)
- 63.
Bhatia G, Patterson N, Pasaniuc B, Zaitlen N, Genovese G, et al (2011 ) Genome-wide com-parison of African-ancestry populations from CARe and other cohorts reveals signals of natural selection. Am J Hum Genet 89: 368–81.
Not in our library10.1016/j.ajhg.2011.07.025 (opens in a new tab)
- 64.
Bonhomme M, Chevalet C, Servin B, Boitard S, Abdallah J, et al (2010 ) Detecting selection in population trees: the Lewontin and Krakauer test extended. Genetics 186: 241–62.
Not in our library10.1534/genetics.110.117275 (opens in a new tab)
- 65.
Myers S, Hellenthal G, Lawson D, Busby G, Leslie S, et al. (2011). LD patterns in dense variation data reveal information about the history of human populations worldwide. URL http://www.ichg2011.org/cgi-bin/ichg11s?&sort=ptimes&sbutton=Detail&absno=21708&sid=806980.
Not in our library
- 66.
Lawson CL, Hanson RJ (1995) Solving least squares problems. Philadelphia, PA: Society for Industrial Mathematics, 3rd edition.
Not in our library
- 67.
Press WH, Teukolsky SA, Vetterling WT, Flannery BP (1992) Numerical recipes in C (2nd ed.): the art of scientific computing. New York, NY, USA: Cambridge University Press.
Not in our library
- 68.
Lindblad-Toh K, Wade CM, Mikkelsen TS, Karlsson EK, Jaffe DB, et al (2005 ) Genome sequence, comparative analysis and haplotype structure of the domestic dog. Nature 438: 803–19.
Not in our library10.1038/nature04338 (opens in a new tab)
- 69.
Hudson RR (2002 ) Generating samples under a Wright-Fisher neutral model of genetic varia-tion. Bioinformatics 18: 337–8.
Not in our library10.1093/bioinformatics/18.2.337 (opens in a new tab)
- 70.
Sukumaran J, Holder MT (2010 ) DendroPy: a Python library for phylogenetic computing. Bioinformatics 26: 1569–71.
Not in our library10.1093/bioinformatics/btq228 (opens in a new tab)
Cited by papers we hold46
Whole-genome resequencing reveals the origin of tea in Lincang · 2022
Not checkedGenetic ancestry, admixture, and population structure in rural Dominica. · 2021
Not checkedAssessment of genetic drift and migration in six cattle breeds · 2020
Not checkedWhat is ancestry? · 2020
- Corrected
High-depth African genomes inform human migration and health · 2020
Distinct genetic variation and heterogeneity of the Iranian population. · 2019
Not checked
and 26 more
Reads
Read by people on this page
None yet.
Checked or read by AI through naulon
None yet.
A person counts once a day per paper. We keep no cookie and no address: a reader is a hash that changes every day. Any month under five reads shows no number.
Are you an author?
Is this your paper?
Claim it to add your note and be paid when agents cite it. Free.