Circulating Exosomal miRNA Profile During Term and Preterm Birth Pregnancies: A Longitudinal Study
Ramkumar Menon, Chirantan Debnath, Andrew Lai and 6 more
Endocrinology · 2018 · CC BY
doi:10.1210/en.2018-00836 (opens in a new tab)
We email you when a new notice or a question about this paper appears.
Abstract
Despite decades of research in the field of human reproduction, the mechanisms responsible for human parturition still remain elusive.The objective of this study was to describe the changes in the exosomal miRNA concentrations circulating in the maternal plasma between mothers delivering term and preterm neonates, across gestation using a longitudinal study design.This descriptive study identifies the miRNA content in exosomes present in maternal plasma of term and preterm birth (PTB) (n = 20 and n = 10 per each gestational period, respectively) across gestation (i.e., first, second, and third trimesters and at the time of delivery).Changes in exosomal miRNA signature in maternal plasma during term and preterm gestation were determined using the NextSeq 500 high-output 75 cycles sequencing platform.A total of 167 and 153 miRNAs were found to significantly change (P , 0.05) as a function of the gestational age across term and PTB pregnancies, respectively.Interestingly, a comparison analysis between the exosomal miRNA profile between term and PTB reveals a total of 173 miRNAs that significantly change (P , 0.05) across gestation.Specific trends of changes (i.e., increase, decrease, and both) as a function of the gestational age were also identified.The bioinformatics analyses establish that the differences in the miRNA profile are targeting signaling pathways associated with TGF-b signaling, p53, and glucocorticoid receptor signaling, respectively.These data suggest that the miRNA content of circulating exosomes in maternal blood might represent a biomolecular "fingerprint" of the progression of pregnancy.(Endocrinology 160: 249-275, 2019) N ormal term human parturition is initiated when fetal organ systems are matured at any time between 37 and 40 weeks of gestation.Conventional theories of parturition initiation signaling are primarily linked to fetomaternal endocrine and immune changes in the intrauterine cavity, correlating with fetal growth and development (1).Homeostatic imbalances produced by these changes, specifically biochemicals released by maturing fetal organs, can lead to an inflammatory overload that disrupts the maintenance of pregnancy, resulting in labor-related changes (2-4).More precise knowledge of these signals and their mechanisms in normal term pregnancies can provide insight into pathologic activation of these signals, which can cause spontaneous preterm parturitions.Besides the fetus, fetal components of the intrauterine tissues (fetal membranes and placenta) also contribute to parturition initiation signals.Recently, we and others have reported that senescence of the placenta/membranes generates "sterile inflammation" that can enhance inflammatory load in
Full text
From PubMed Central, U.S. National Library of Medicine, as current on Oct 25, 2026. Paragraph numbers are ours, so an answer can point at one.
Normal term human parturition is initiated when fetal organ systems are matured at any time between 37 and 40 weeks of gestation. Conventional theories of parturition initiation signaling are primarily linked to fetomaternal endocrine and immune changes in the intrauterine cavity, correlating with fetal growth and development. Homeostatic imbalances produced by these changes, specifically biochemicals released by maturing fetal organs, can lead to an inflammatory overload that disrupts the maintenance of pregnancy, resulting in labor-related changes. More precise knowledge of these signals and their mechanisms in normal term pregnancies can provide insight into pathologic activation of these signals, which can cause spontaneous preterm parturitions. Besides the fetus, fetal components of the intrauterine tissues (fetal membranes and placenta) also contribute to parturition initiation signals. Recently, we and others have reported that senescence of the placenta/membranes generates “sterile inflammation” that can enhance inflammatory load in the maternal uterine tissues capable of triggering parturition.
Communication between the fetal tissues and maternal organs is fundamental for a healthy pregnancy, and recently the participation of extracellular vesicles, especially in a specific type of extracellular vesicles originated from endosomal compartments, called exosomes, in cell-to-cell communication has been identified. We have recently identified the fetal-derived signaling through exosomes by senescent fetal membrane (amniochorion) cells at term. Exosomes transport materials from cells and function as intercellular communication channels. Exosomes are generated by the intraluminal invagination of early endosomes, giving rise to multivesicular bodies and released into the extracellular environment upon the fusion of multivesicular bodies with the plasma membranes. Exosome contents represent the character, that is, the physiologic and metabolic state, of the cell of origin. This makes the exosomes a good vector of paracrine signaling as well as biochemical indicators of function of the cell of origin. Therefore, the placenta and placental membrane cells provide functional contributions during pregnancy and signal their status through exosomes, contributing to the pregnancy and promotion of fetal delivery (as well as their own) when the fetus is mature.
Exosomes are involved in cell-to-cell signaling mainly due to their inherent property to carry bioactive molecules (consisting of proteins, bioactive lipids, and RNAs), which are delivered to the target cells to regulate the biological functions. Interestingly, exosomes are enriched in small noncoding RNA such as miRNAs. miRNAs are a class of small (∼22 nucleotides long) noncoding RNAs that negatively regulate gene expression by binding to the 3′ untranslated region of target mRNAs. Interestingly, several studies have demonstrated that changes in the maternal circulating miRNAs or in placental tissues might reflect the maternal metabolic state that may be used as biomarkers of pregnancy complications. Functional studies have also shown the roles of miRNAs in regulating myometrial contractility during parturition. However, most studies have been conducted on identifying the total circulating miRNAs (i.e., a mix of soluble, protein-associated, and vesicle-associated miRNAs) and at single time point during gestation, as a cross-sectional study design.
Multiple reports have identified the usefulness of placental-derived exosomes in predicting high-risk status for various adverse pregnancy outcomes. These include preeclampsia, gestational diabetes, and intrauterine growth restriction. Thus, the fetal tissue exosomes serve as proxy for underlying tissue level changes in normal and abnormal pregnancies. Therefore, the role of circulating exosomes in maternal blood merits further investigation. We designed a non–hypothesis-driven, descriptive study to discover exosome miRNA cargoes that are differentially expressed in total maternal plasma to generate a profile of their longitudinal changes during each stage of gestation and real-time insight into functional changes associated with gestational age in term and preterm birth (PTB) pregnancies. We also determined whether these miRNA signatures differ between preterm and term births and correlated their likely functions and reasons for their overabundance at a given state of pregnancy based on bioinformatics analysis.
Study group and biospecimen collection
A hospital-based cohort of pregnant women was initiated in 2015 at a district hospital in Gurugram, Haryana (Gurugram Civil Hospital, GCH), India by the Pediatric Biology Center, Translational Health Science and Technology. Serial biospecimens are being collected across pregnancy (at the first, second, and third trimesters), at delivery, and after delivery. Ultrasound images are acquired serially during pregnancy, and the period of gestation is confirmed at enrolment by performing a dating ultrasound using standard fetal biometric parameters. Well-characterized clinical and environmental information is also maintained. The sample preparation at the study site is carried out in the research laboratory established at GCH on nationally accredited equipment from the National Accreditation Board for Testing and Calibration Laboratories. Plasma samples are stored at –80°C until analyses. All women provide written informed consent, and the study is approved by the Institute and Hospital Ethics Review Board.
Selection of samples for this study
The selection of biospecimens for this study has been carried using a nested case control design. The cases and controls have been selected from a defined universe comprised of participants who had a normal singleton vaginal delivery, with no congenital abnormalities or associated comorbidity (e.g., preeclampsia, gestational diabetes, pregnancy-induced hypertension, medical condition complicating complication) at any time in pregnancy. The cases were subjects delivered preterm defined as <37 completed weeks period of gestation. Participants who delivered at >37 completed weeks to 40 completed weeks were considered as controls. The cases and controls were matched to parity, sex of the baby, and month of delivery.
Enrichment of exosomes from maternal blood
Exosomes were isolated from plasma as previously described. In brief, plasma was diluted with an equal volume of PBS (pH 7.4) and centrifuged at 2000g for 30 minutes at 4°C (Sorvall® high-speed microcentrifuge, fixed rotor; Thermo Fisher Scientific, Asheville, NC). The 2000g supernatant fluid was then centrifuged at 12,000g for 45 minutes at 4°C (Sorvall® high-speed microcentrifuge, fixed rotor; Thermo Fisher Scientific). The resultant supernatant fluid (2 mL) was transferred to an ultracentrifuge tube (10 mL; Beckman, Brea, CA) and centrifuged at 100,000g for 2 hours (Sorvall® T-8100 fixed ultracentrifuge rotor). The 100,000g pellet was suspended in PBS (10 mL) and filtered through a 0.22-μm filter (Steritop™; Millipore, Billerica, MA) and then centrifuged at 100,000g for 2 hours. Finally, the pellet containing the enriched exosome population was resuspended in 250 μL of PBS for the characterization of exosomes and RNA extraction.
Transmission electron microscopy
For electron microscopy analysis, exosome pellets were fixed in 3% (w/v) glutaraldehyde and analyzed under an FEI Tecnai 12 transmission electron microscope (FEI, Hillsboro, OR) as we previously described.
Western blot
Western blot was performed to ascertain the identity of the exosomes using exosomal-specific markers (TSG101, CD9, and CD63) as well as Golgi marker Grp94, which is not enriched in exosomes. Standard Western blot protocols were used and the detailed protocols can be seen our prior reports. An Odyssey® CLx imaging system (LI-COR Biosciences, Lincoln, NE) was used to visualize the fluorescent bands.
Nanoparticle tracking analysis
Nanoparticle tracking analyses were performed using a NanoSight NS500 instrument (NanoSight NTA 2.3 nanoparticle tracking and analysis release version build 0033; Malvern Instruments, Malvern, United Kingdom) following the manufacturer’s instructions. Samples were diluted 1:1000 with Dulbecco’s PBS to obtain 10:100 particles per image (optimal ∼50 particles per image). The NS500 instrument measured the rate of Brownian motion of nanoparticles in a light-scattering system that provides a reproducible platform for specific and general nanoparticle characterization (NanoSight, Amesbury, United Kingdom). Suspended nanoparticles were passed through the laser beam that traversed the sample chamber and scattered the light, discerning the nanoparticles through a microscope. The samples were mixed before introducing them into the chamber (temperature, 25°C), and the camera level was set to obtain an image that had sufficient contrast to clearly identify particles while minimizing background noise (camera level, 10; capture duration, 30 seconds). The captured videos (two videos per sample) were then processed and analyzed. Each video file was processed and analyzed to give the mean and mode of particle sizes, along with the concentration and the number of particles. An Excel spreadsheet was automatically generated and data were imported into GraphPad Prism 7 (La Jolla, CA).
Exosomal RNA isolation
Exosomal RNA was extracted using an RNeasy Mini Kit 50 (Qiagen, Hilden, Germany) and TRIzol LS reagent (Life Technologies, Carlsbad, CA). The manufacturers’ protocols were followed, with slight modifications in accordance with a protocol used previously. A spectrophotometer (SPECTROstar Nano microplate reader; BMG Labtech, Cary, NC) was used to quantify RNA concentration. Following a cleanliness check and blank measurement using RNase-free water, 2 μL of sample was pipetted onto each microdrop well on an LVis plate. RNA concentration was measured using MARS data analysis microplate reader software.
Next-generation sequencing
Sequencing libraries were generated using the TruSeq Small RNA Library Prep Kit (Illumina, San Diego, CA), according to the manufacturer’s instructions, and as previously described. Two hundred to 800 ng of exosomal RNA was used as input for library preparation. These RNA samples were barcoded by ligation with unique adaptor sequences to allow pooling of samples in groups of 24. Subsequently, these ligated samples were reverse transcribed, PCR amplified, and size selected using gel electrophoresis. Finally, the DNA libraries were eluted from the gel pieces overnight in 200 μL of nuclease-free H2O. The elution containing the pooled DNA library was further processed for cluster generation and sequencing using a NextSeq 500 high-output kit 75 cycles and Illumina NextSeq 500 sequencing platform, respectively.
Statistical analysis and bioinformatics analysis
The number of exosomes released from individuals are represented as mean ± SE (n = 20 for term and n = 10 for PTB, independent isolations from each patient from each trimester). For RNA sequencing, first the FASTQ file generated from next-generation sequencing was preprocessed to remove adaptor sequences using the TagCleaner program (http://edwards.sdsu.edu/tagcleaner). Subsequently, known and novel miRNAs were detected within the preprocessed FASTQ data using the miRDeep2 program. After detection, the miRNA counts and corresponding miRNAs were extracted from the output file. Differential expression and statistical analysis of sequencing data were performed by the DESeq2 package in R. This package uses a generalized linear model to perform differential expression. Statistical analysis and significance were calculated using various tests and adjusted for multiple testing. Adjusted statistical significance was assessed as P < 0.001–0.05. Sequencing data have been deposited in the Gene Expression Omnibus database under no. GSE115572. The effect of pregnancy condition (i.e., normal or PTB) on the size distribution (mean and mode) of the exosomes was assessed using a pairwise post hoc test (Tukey honest significant difference test). No significant differences (P > 0.05) were observed.
Description of the participants
Table 1 describes the comparison between the demographic and the clinical characteristics of the cases and controls. No significant differences between various sociodemographic parameters were seen between cases and controls, except for body mass index (which has been adjusted in our analysis).
Exosome isolation and characterization
Particles between 30 and 120 nm were identified on nanoparticle tracking analysis and analyzed per trimester (Fig. 1A–1C), and the cup-shaped morphology was identified using electron microscopy (Fig. 1D). Exosomes were found to be positive for CD63, CD9, and TSG101 (Fig. 1E) but negative for Golgi marker Grp94. No differences were observed in size distribution, protein abundance (CD9, CD63, and TSG101), and morphology between exosomes isolated from term and PTB.
Exosomal miRNA signature across normal pregnancy
A total of 167 miRNAs across gestation in term pregnancies revealed significant changes (P < 0.05). Hierarchical clustering analysis of the average miRNA expression profiles across gestation revealed a variety of trends (Fig. 2). Specifically, trends that increased to a maximum peak expression in the third trimester are clusters A and C (A = 11, C = 15); trends that rapidly decreased in expression until the end of the first trimester and then increased to a peak at the end of the second trimester are clusters B, F, G, I, J, K, L, M, and N (B = 13, F = 2, G = 11, I = 13, J = 13, K = 21, L = 4, M = 13, N = 23); an increasing trend throughout gestation was identified in cluster E (E = 19); a trend that rapidly decreased in expression until the end of the first trimester and then increased in expression until the end of the third trimester was observed for cluster H (H = 2); and a trend that increased rapidly from the beginning of the third trimester is cluster D (D = 7). miRNAs with the largest maximum expression in each cluster are as follows (Fig. 3; Table 2): A, hsa-miR-3200-5p; B, hsa-miR-320a; C, hsa-miR-25-3p; D, hsa-miR-10b-3p; E, hsa-miR-143-3p; F, hsa-miR-4718; G, hsa-miR-203a-3p; H, hsa-miR-6862-1-5p; I, hsa-miR-3117-3p; J, hsa-miR-8060; K, hsa-miR-324-5p; L, hsa-miR-129-1-5p; M, hsa-miR-6769b-5p; and N, hsa-miR-6715a-3p.
Exosomal miRNA signature across PTB pregnancy
A total of 153 miRNAs across gestation in PTB pregnancies demonstrated significant changes (P < 0.05). Hierarchical clustering analysis of the average miRNA expression profiles across gestation revealed a variety of trends (Fig. 4). Specifically, trends that had peak expression at the second trimester are clusters E, F, G, I, J, K, L, M, and N (E = 3, F = 4, G = 21, I = 5, J = 5, K = 8, L = 10, M = 9, N = 28); a trend that had peak expression at the beginning of the third trimester was identified in cluster A (A = 11); and decreasing trends in expression across gestation were observed for clusters B, C, D, and H (B = 12, C = 6, D = 20, H = 11). miRNAs with the largest maximum expression in each cluster are as follows (Fig. 5; Table 3): A, hsa-let-7a-2-5p; B, hsa-miR-520a-3p; C, hsa-miR-664a-3p; D, hsa-miR-4737; E, hsa-miR-3177-3p; F, hsa-miR-483-3p; G, hsa-miR-4433b-3p; H, hsa-miR-130b-3p; I, hsa-miR-142-5p; J, hsa-miR-941-1; K, hsa-miR-342-3p; L, hsa-miR-222-3p; M, hsa-miR-26a-2-5p; and N, hsa-miR-92a-1-3p.
Differential expression of exosomal miRNA across gestation in normal compared with PTB pregnancy
A total of 173 miRNAs were found to significantly change (P < 0.05) across gestation for normal compared with PTB pregnancies. Hierarchical clustering analysis of the average miRNA expression profiles across gestation revealed a variety of trends (Fig. 6). Specifically, trends that had the largest difference in expression within the first trimester comparing normal to PTB pregnancies are clusters I, M, and N (I = 8, M = 15, N = 43); trends that had the largest difference in expression within the second trimester comparing normal to PTB pregnancies are clusters A, D, F, G, J, and K (A = 14, D = 5, F = 5, G = 8, J = 17, K = 13); and trends that had the largest difference in expression within the third trimester comparing normal to PTB pregnancies are clusters B, C, E, H, and L (B = 5, C = 9, E = 12, H = 6, L = 13). miRNAs with the largest maximum expression in each cluster are as follows (Fig. 7; Table 4): A, hsa-let-7b-3p; B, hsa-miR-197-3p; C, hsa-miR-148a-3p; D, hsa-miR-1304-3p; E, hsa-miR-101-1-3p; F, hsa-miR-10a-3p; G, hsa-miR-1304-5p; H, hsa-miR-145-5p; I, hsa-let-7i-3p; J, hsa-miR-128-1-3p; K, hsa-miR-1275; L, hsa-miR-1249-5p; M, hsa-miR-202-5p; and N, hsa-miR-1255b-2-3p.
Pathway analysis and gene target and gene ontology prediction
Gene target and pathway analyses of the largest maximum expression exosomal miRNAs that were revealed to be differentially expressed in term, PTB, and term vs PTB across gestation were analyzed using in silico tools, including the CyTargetLinker application in Cytoscape, as well as Ingenuity pathway analysis (IPA). In term, PTB, and term vs PTB pregnancies, the largest maximum expression miRNAs were linked to 645, 1677, and 686 target genes, respectively, and these gene targets were represented in at least two miRNA databases. The target genes of the differentially expressed miRNAs were subjected to gene ontology analysis using the BiNGO application in Cytoscape that identified a total of 1000, 1172, and 995 gene ontology terms, respectively, being regulated by these miRNAs. Within this gene ontology network, pathways regulating the immune system process were enriched (P < 0.05) in term and PTB pregnancies (Fig. 8A and 8B). Then, we performed a bioinformatics analysis on the largest maximum expression miRNA profile in term, PTB, and term vs PTB analysis, and our data establish that the differences in the miRNA profile between these groups target the signaling pathways associated with TGF-β signaling, p53, and glucocorticoid receptor signaling, respectively (Fig. 8C–8E).
Discussion
The aim of this study was to characterize serial changes in the exosomal miRNA concentration present in maternal circulation across gestation in term and PTB pregnancies. We implemented an innovative approach using linear mixed modeling to determine exosomal miRNA expression as a function of gestational age in term and PTB pregnancies. The data obtained identified exosomal miRNA changes specific to term and PTB as a function of the gestational age during pregnancy.
Exosomal miRNA changes in normal pregnancies
miRNA clusters that are differentially regulated are functionally linked to various physiologic and pathologic conditions during pregnancy. These functions include regulation of cell growth (miR-3200), control of cell transition factors in female reproductive tract by IGF receptor 1 and TGF-β receptor 2 functions (miR-3200-5p), anomalous placentation (miR-320a), epithelial mesenchymal transition involved in tissue remodeling (miR-25-3p), gestational hypertension, preeclampsia, and intrauterine growth restriction (miR-143-3p), cell proliferation and migration (miR129-1 cluster), oocyte aging and embryogenesis (miR-203a-3p), cell proliferation and migration (miR-324-5p), MAPK function and induction of cell cycle arrest as seen in senescent uterine cells (miR129-1 cluster), and immune responses and inflammatory reactions (miR-6769b-5p).
miRNAs collectively represent TGF-β signaling during various stages of gestation ending in term deliveries. TGF-β is an anti-inflammatory cytokine, and ongoing work in the Menon laboratory suggests that they can contribute to epithelial mesenchymal transitions of amnion epithelial cells to maintain fetal membrane homeostasis. In placenta, TGF-β1 and IGFBP-3 have been shown to signal through TGF-β receptors to influence human cytotrophoblast proliferation. Similarly, TGF-β1 upregulates connexin43-mediated gap junctional intercellular communication required for human trophoblast differentiation. Therefore, miRNA profiling in exosomes during normal gestation and parturition indicates that TGF-β–mediated tissue homeostasis (regulates cellular proliferation and transitions) is required for pregnancy maintenance.
Exosomal miRNA changes in PTB
Examination of differentially expressed exosomal miRNA in PTB samples provided more distinct clusters than for normal birth. A summary of functional roles already reported for many of the miRNAs identified in exosomes from PTB suggests that miRNAs are functionally linked to cell cycle regulation (let-7a-2-5p), MAPK kinase kinases and inhibition of cell growth (miR-520a-3p), cellular transitions and inflammation (miR-520a-3p and miR-483-3p), placental oxidative stress response and impairment of mitochondrial function (miR-130b-3p and miR-4433b-3p), macrophage programming contributing to inflammatory and oxidative stress damages (miR-142-5p), preeclampsia (miR-342-3p), as well as placental dysfunction and impaired fetal growth due to folate deficiency (miR-222-3p).
PTB
One of the key pathways affected in PTB (as determined in our IPA analysis) is a p53-mediated mechanism. The function of p53 is overtly represented in exosomes during gestation ending in PTB compared with normal term birth. p53 is a well-reported tumor suppressor protein that is implicated in placental and decidual cell senescence and fetal membrane apoptosis. Overrepresentation of the p53 pathway in exosomes during pregnancies ending in PTB suggests disturbances in normal cell cycle indicative of cellular senescence and/or programmed cell death.
IPA analysis of differentially expressed miRNAs represented glucocorticoid signaling as one of the key pathways implicated in PTB. Several reports by Zakar et al. and Zakar and Olson have shown the effect of glucocorticoids on prostaglandin production (uterotonin) as well as their role in organ maturation and fetal growth. In most mammalian species, increased concentrations of glucocorticoids are evident in the maternal and fetal circulations and amniotic fluid prior to the onset of labor. Glucocorticoids directly increase fetal placental prostaglandin production, and they indirectly increase prostaglandin production by maternal uterine tissues through the stimulation of placental estradiol synthesis. Thus, exosomal miRNA representation of glucocorticoid signaling implicates untimely activation of this signaling in PTB during early gestation compared with those ending in normal term deliveries.
The strengths of this study are longitudinal sampling at four separate time points from a well-defined cohort of subjects and technological approaches to isolate and characterize exosomal miRNAs. This study precisely is a hypothesis-generation work, and the pathways and networks identified in this study still need further testing using in vitro cell culture models or animal models. We have correlated the networks and pathways to pregnancy whenever data were available in the literature and or suggested potential functions based on the reported functions in other systems. Another important point about this study is that we profiled the miRNAs associated with the total circulating exosomes present in maternal plasma across gestation, and the origin of these exosomes (i.e., placenta) was not identified. Owing to technical difficulties, miRNA quantity that can be obtained from the fetal portion of maternal plasma (∼15% to 20%) is not sufficient to yield a fetal-only miRNA signature. Thus, the miRNA profile is an indication of an overall change in fetal as well as maternal tissues and is not restricted to either fetal or uterine tissues. Regardless, the exosome miRNA profile is unique at different trimesters, at term and preterm, and it differs substantially between pregnancies ending up with preterm and term births. Irrespective of origin of exosomes, these are indicative of overall physiologic changes in fetomaternal tissues.
In summary, the exosomal miRNAs showing maximum expression for each trend of change were associated with inflammation and cellular movement for term pregnancy. Alternatively, the top molecular and cellular functions targeted by the top exosomal miRNAs in PTB were cell-to-cell signaling and interaction, cellular growth and proliferation, and cellular development. Comparative analysis between the exosomal miRNA in term and PTB reveals that main differences are in cell morphology and cellular development. The data presented in this study establish that circulating exosomes carry a specific set of miRNAs as a function of the gestational age in term pregnancy, and that the circulating exosomal miRNA profile changes in PTB pregnancies compared with normal term deliveries. We posit that exosomes may contribute to the inflammatory state and metabolic changes associated with pregnancy by the specific incorporation of miRNAs, which might be delivered to maternal cells to support the normal maternal physiological changes during gestation, a phenomenon dysregulated in PTB pregnancies.
Figures8
From PubMed Central, U.S. National Library of Medicine.
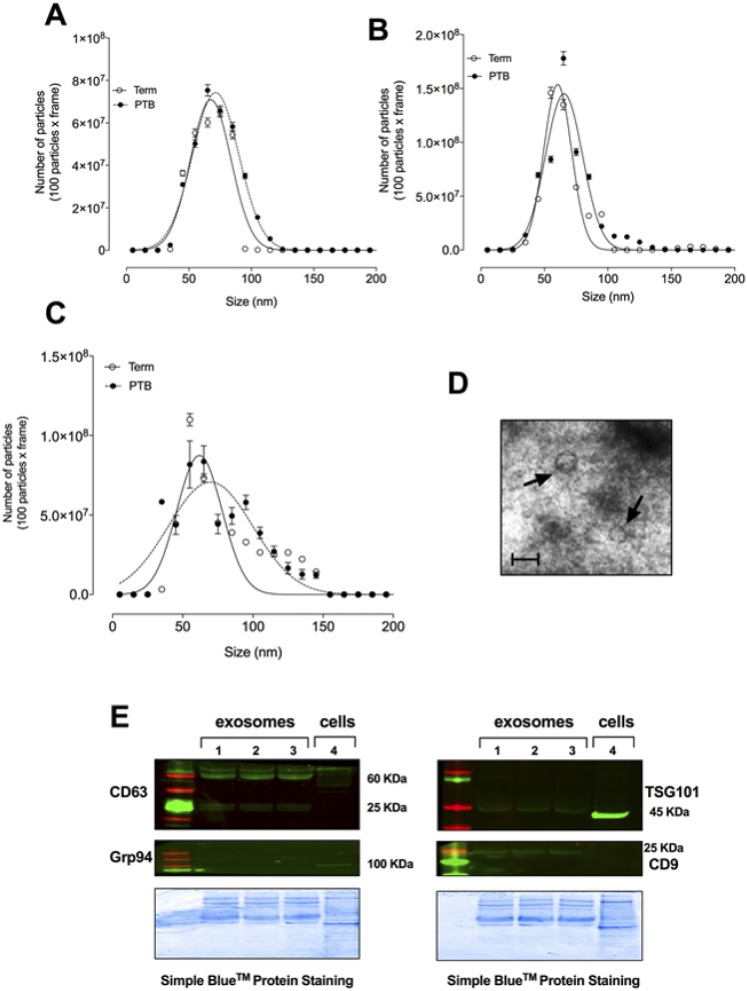
Figure 1.
Full legend
Isolation of exosomes. Exosomes were isolated from maternal plasma obtained from normal and PTB pregnancies across gestation (see “Subjects and Methods”). (A–C) Graphical representation of the vesicle size distribution using a NanoSight NS500 instrument at different time points during pregnancy [(A) first trimester, (B) second trimester, and (C) third trimester]. (D) Representative image of electron micrograph of exosomes. Scale bar, 100 nm. (E) Representative Western blot for enriched exosome markers CD63, CD9, and TSG101, as well as negative control Grp94 for exosomes isolated from normal and PTB at different time points during pregnancy. In (A)–(C) and (E), none of the experiments performed was significantly different for normal vs PTB.
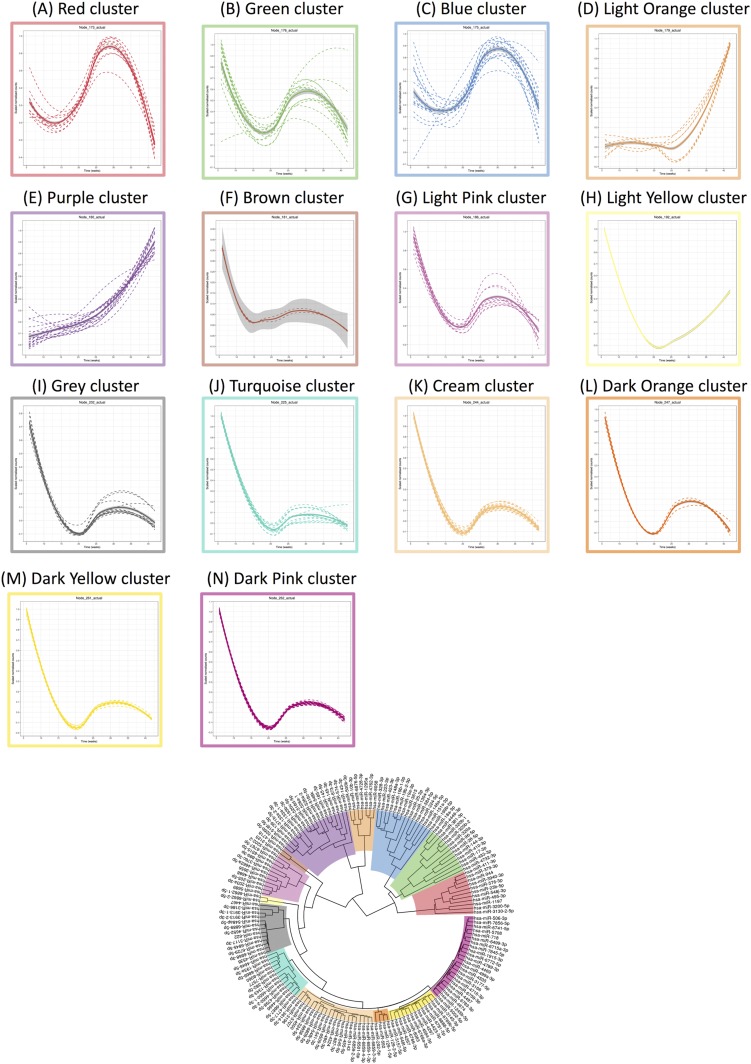
Figure 2.
Full legend
Linear mixed modeling of 167 statistically significant miRNAs that change across gestation for normal pregnancies. miRNA counts were normalized using the DESeq2 package in R prior to statistical analysis using the likelihood ratio test. Subsequently, linear mixed modeling was performed on the 167 statistically significant miRNAs (P < 0.05) that change across gestation for normal pregnancies, using the lme4 package in R. The data were scaled between 0 and 1 before hierarchical clustering analysis using Euclidean distance, which is displayed as a circular cladogram (generated using the ggtree package in R). Each color of the circular cladogram represents a different cluster and its trend, as shown in (A)–(N).
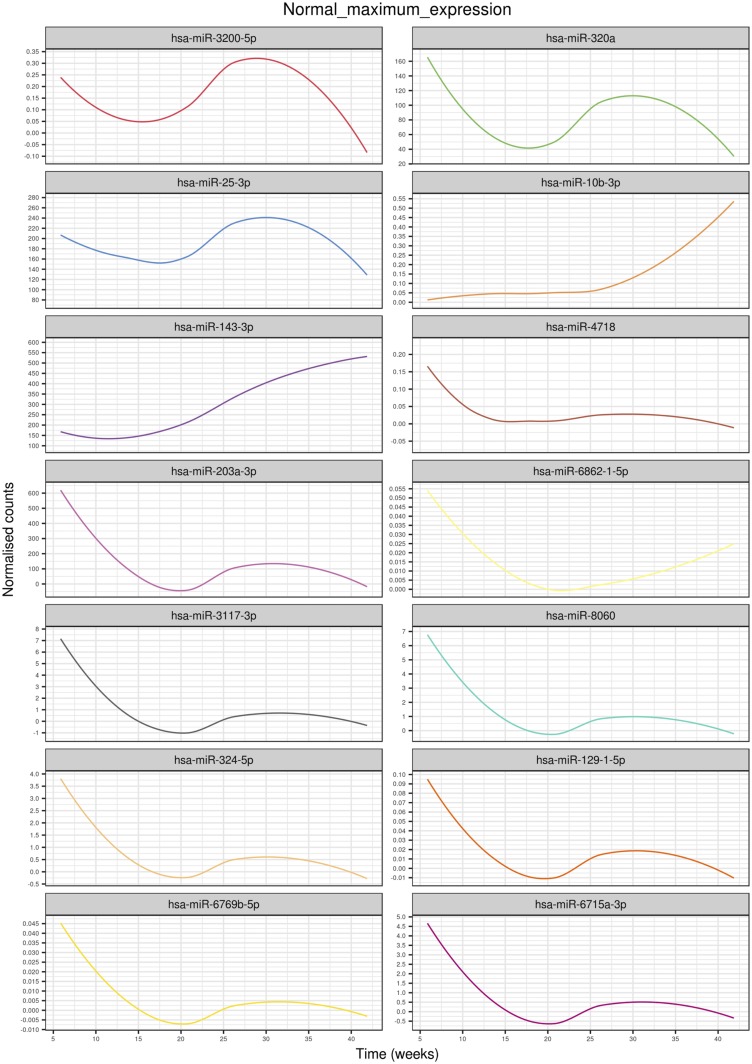
Figure 3.
Full legend
Highest expressed miRNAs in each cluster identified using linear mixed modeling for normal pregnancies across gestation. Linear mixed modeling and circular cladogram analysis for normal pregnancies across gestation were divided into 14 clusters. The highest expressed miRNA from each cluster was extracted and color coded based on the cluster of origin. Clusters are in ascending order [corresponding to (A)–(N) in Fig. 2] starting from the top of the figure, reading from left to right and continuing onto the next line of graphs below.
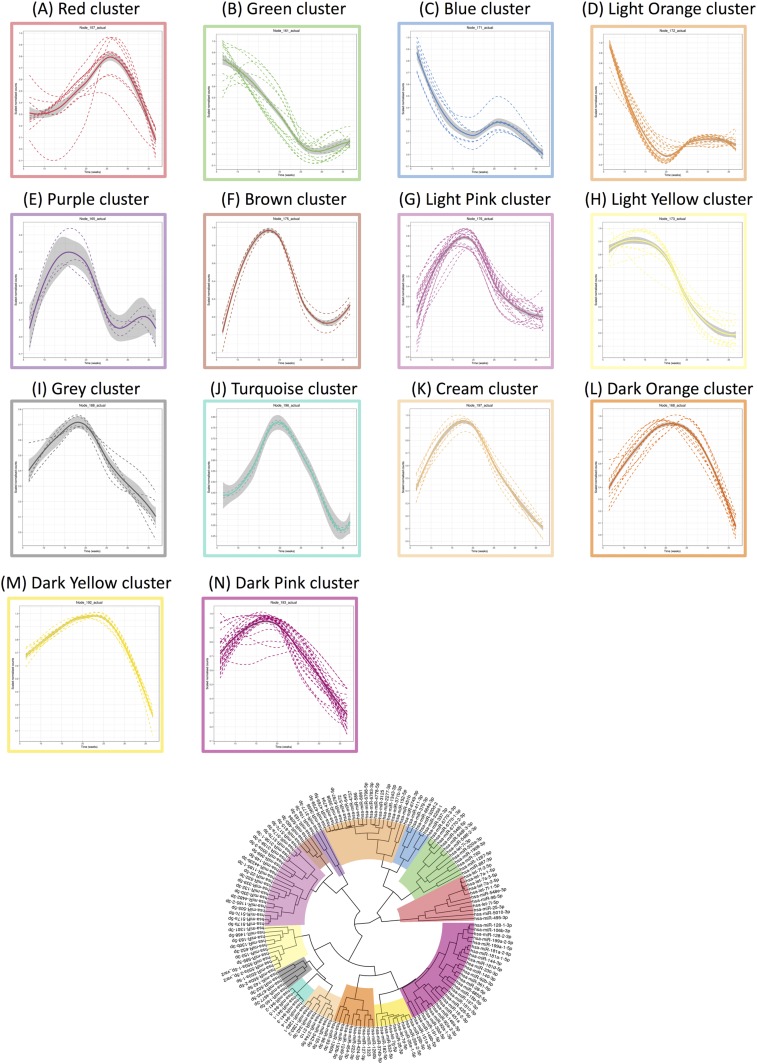
Figure 4.
Full legend
Linear mixed modeling of 153 statistically significant miRNAs that change across gestation for PTB pregnancies. miRNA counts were normalized using the DESeq2 package in R prior to statistical analysis using the likelihood ratio test. Subsequently, linear mixed modeling was performed on the 153 statistically significant miRNAs (P < 0.05) that change across gestation for PTB pregnancies, using the lme4 package in R. The data were scaled between 0 and 1 before hierarchical clustering analysis using Euclidean distance, which is displayed as a circular cladogram (generated using the ggtree package in R). Each color of the circular cladogram represents a different cluster and its trend, as shown in (A)–(N).
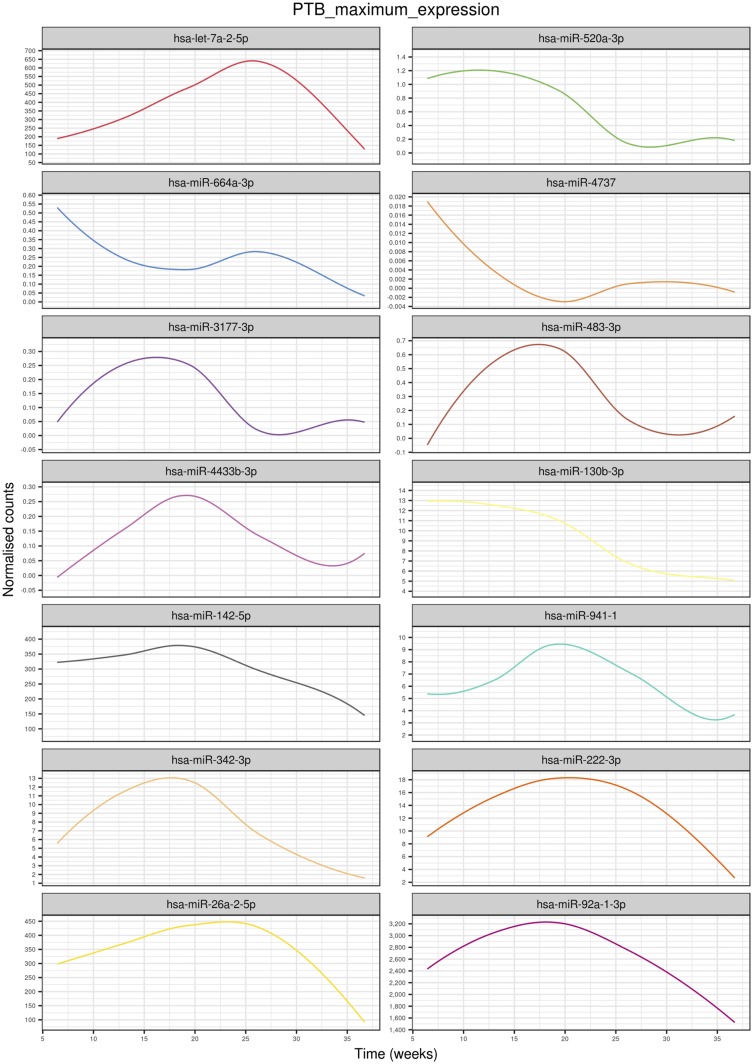
Figure 5.
Full legend
Highest expressed miRNAs in each cluster identified using linear mixed modeling for PTB pregnancies across gestation. Linear mixed modeling and circular cladogram analysis for normal pregnancies across gestation were divided into 14 clusters. The highest expressed miRNA from each cluster was extracted and color coded based on the cluster of origin. Clusters are in ascending order [corresponding to (A)–(N) in Fig. 4] starting from the top of the figure, reading from left to right and continuing onto the next line of graphs below.
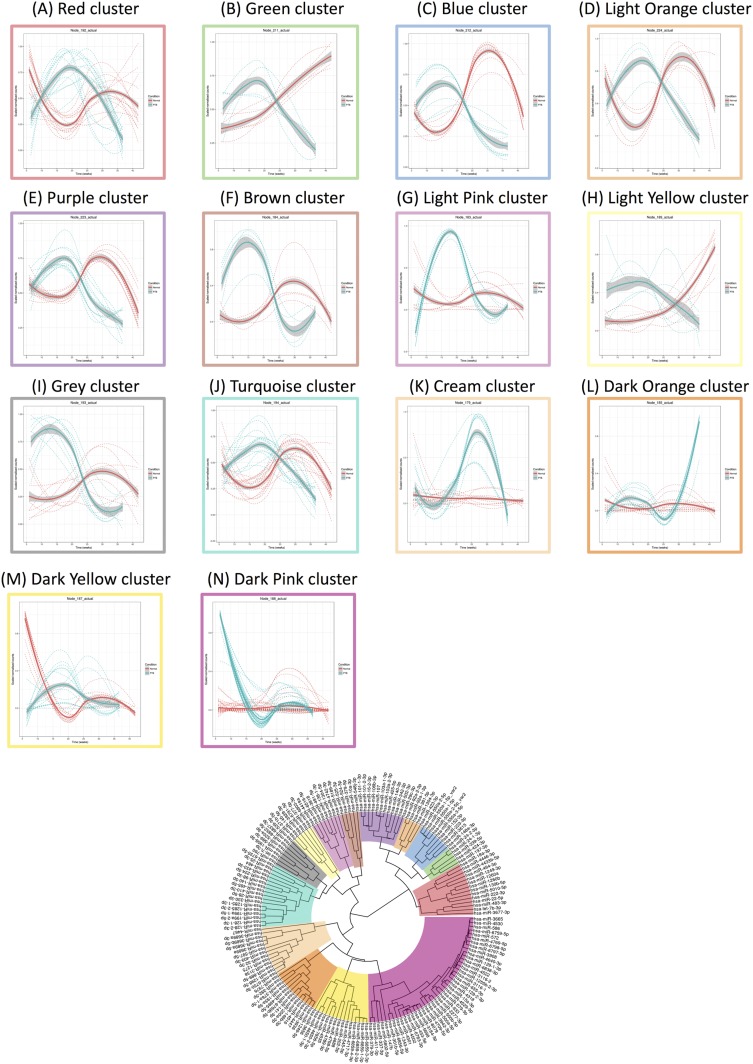
Figure 6.
Full legend
Linear mixed modeling of 173 statistically significant miRNAs that change across gestation when comparing normal to PTB pregnancies. miRNA counts were normalized using the DESeq2 package in R prior to statistical analysis using the likelihood ratio test. Subsequently, linear mixed modeling was performed on the 173 statistically significant miRNAs (P < 0.05) that change across gestation when comparing normal to PTB pregnancies, using the lme4 package in R. The data were scaled between 0 and 1 before hierarchical clustering analysis using Euclidean distance, which is displayed as a circular cladogram (generated using the ggtree package in R). Each color of the circular cladogram represents a different cluster and its trend, as shown in (A)–(N). Within the panels, red indicates normal pregnancies whereas blue indicates PTB pregnancies.
Show all 8 figures
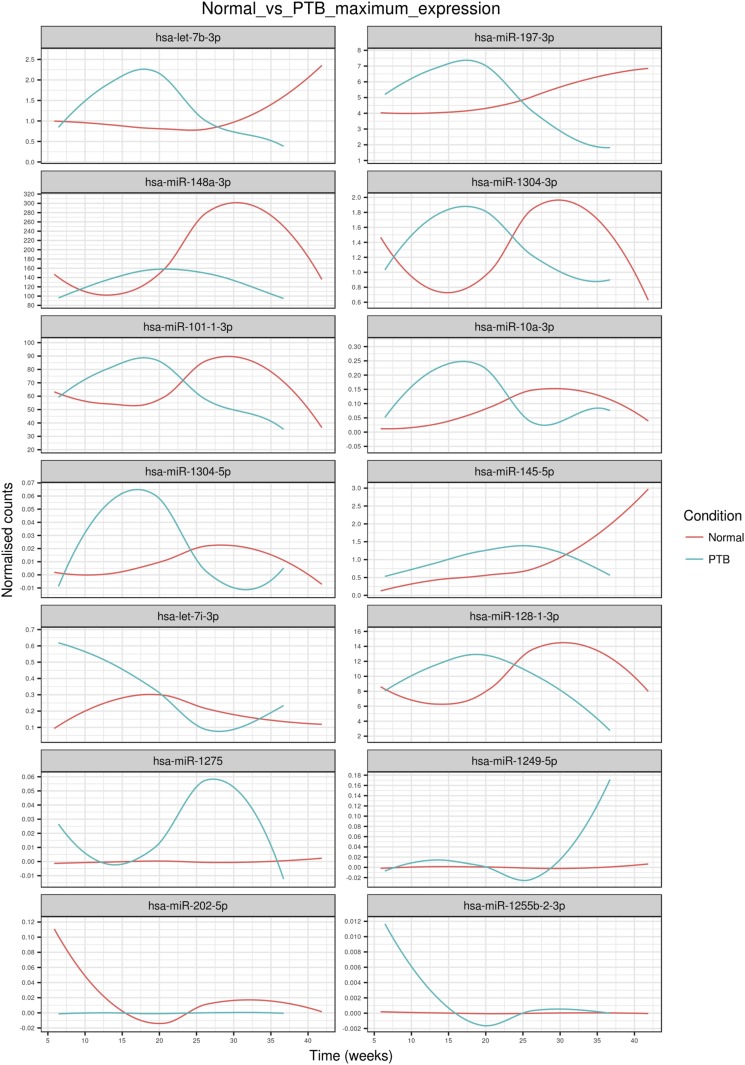
Figure 7.
Full legend
Highest expressed miRNAs in each cluster identified using linear mixed modeling when comparing normal pregnancies to PTB pregnancies across gestation. Linear mixed modeling and circular cladogram analysis when comparing normal pregnancies to PTB pregnancies across gestation were divided into 14 clusters. The highest expressed miRNA from each cluster was extracted and color coded based on the cluster of origin. Clusters are in ascending order [corresponding to (A)–(N) in Fig. 6] starting from the top of the figure, reading from left to right and continuing onto the next line of graphs below. Red indicates normal pregnancies whereas blue indicates PTB pregnancies.
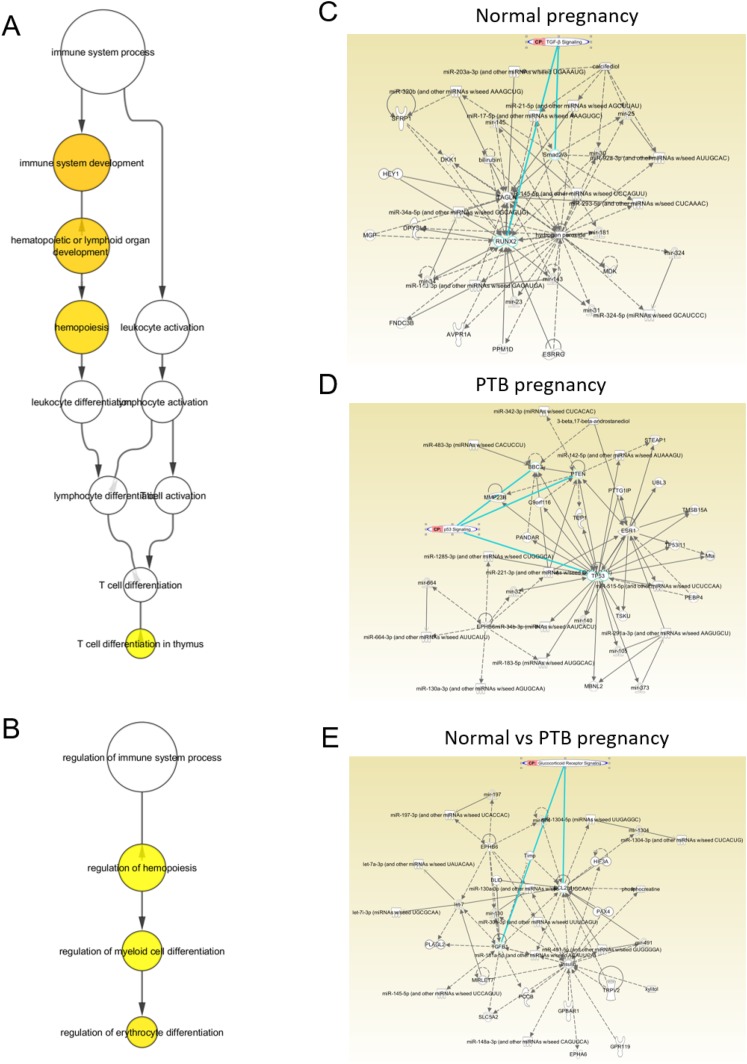
Figure 8.
Full legend
miRNA gene target and gene ontology analysis for the highest abundant miRNAs per cluster in each condition. Gene target analysis for significant and highest abundant miRNAs in each cluster for normal, PTB, and normal vs PTB pregnancies across gestation are shown. Gene ontology analysis for these gene targets showed enrichment for immune systems process in (A) normal and (B) PTB pregnancies. The yellow circles indicate statistically significant gene ontologies (P value <0.05), while the change of color from yellow to orange indicates increasing statistical significance. Bioinformatics analysis on the largest maximum expression miRNA profile in (C) term, (D) PTB, and (E) term vs PTB show differences in the miRNA profile between these groups target signaling pathways (circled in green) associated with (C) TGF-β signalling, (D) p53, and (E) glucocorticoid receptor signalling.
References57
- 1.
Mendelson CR Minireview: fetal-maternal hormonal signaling in pregnancy and labor. Mol Endocrinol. 2009;23(7):947–954.
Not in our library10.1210/me.2009-0016 (opens in a new tab)
- 2.
Challis JR, Smith SK Fetal endocrine signals and preterm labor. Biol Neonate. 2001;79(3–4):163–167.
Not in our library10.1159/000047085 (opens in a new tab)
- 3.
Romero R, Gomez R, Galasso M, Mazor M, Berry SM, Quintero RA, Cotton DB The natural interleukin-1 receptor antagonist in the fetal, maternal, and amniotic fluid compartments: the effect of gestational age, fetal gender, and intrauterine infection. Am J Obstet Gynecol. 1994;171(4):912–921.
Not in our library10.1016/s0002-9378(94)70058-3 (opens in a new tab)
- 4.
Romero R, Espinoza J, Gonçalves LF, Kusanovic JP, Friel LA, Nien JK Inflammation in preterm and term labour and delivery. Semin Fetal Neonatal Med. 2006;11(5):317–326.
Not in our library10.1016/j.siny.2006.05.001 (opens in a new tab)
- 5.
Sultana Z, Maiti K, Aitken J, Morris J, Dedman L, Smith R Oxidative stress, placental ageing-related pathologies and adverse pregnancy outcomes. Am J Reprod Immunol. 2017;77(5):e12653.
Not in our library10.1111/aji.12653 (opens in a new tab)
- 6.
Jin J, Menon R Placental exosomes: a proxy to understand pregnancy complications. Am J Reprod Immunol. 2018;79(5):e12788.
Not in our library10.1111/aji.12788 (opens in a new tab)
- 7.
Bang C, Thum T Exosomes: new players in cell–cell communication. Int J Biochem Cell Biol. 2012;44(11):2060–2064.
Not in our library10.1016/j.biocel.2012.08.007 (opens in a new tab)
- 8.
Hadley EE, Sheller-Miller S, Saade G, Salomon C, Mesiano S, Taylor RN, Taylor BD, Menon R Amnion epithelial cell derived exosomes induce inflammatory changes in uterine cells. Am J Obstet Gynecol. 2018:S0002-9378(18)30674-4.
Not in our library10.1016/j.ajog.2018.08.021 (opens in a new tab)
- 9.
Harding CV, Heuser JE, Stahl PD Exosomes: looking back three decades and into the future [published correction appears in J Cell Biol. 2013;201(3):485]. J Cell Biol. 2013;200(4):367–371.
Not in our library10.1083/jcb.201212113 (opens in a new tab)
- 10.
György B, Szabó TG, Pásztói M, Pál Z, Misják P, Aradi B, László V, Pállinger E, Pap E, Kittel A, Nagy G, Falus A, Buzás EI Membrane vesicles, current state-of-the-art: emerging role of extracellular vesicles. Cell Mol Life Sci. 2011;68(16):2667–2688.
Not in our library10.1007/s00018-011-0689-3 (opens in a new tab)
- 11.
Hornung D, Lebovic DI, Shifren JL, Vigne JL, Taylor RN Vectorial secretion of vascular endothelial growth factor by polarized human endometrial epithelial cells. Fertil Steril. 1998;69(5):909–915.
Not in our library10.1016/s0015-0282(98)00044-2 (opens in a new tab)
- 12.
Menon R, Mesiano S, Taylor RN Programmed fetal membrane senescence and exosome-mediated signaling: a mechanism associated with timing of human parturition. Front Endocrinol (Lausanne). 2017;8:196.
Not in our library10.3389/fendo.2017.00196 (opens in a new tab)
- 13.
Cheng L, Sharples RA, Scicluna BJ, Hill AF Exosomes provide a protective and enriched source of miRNA for biomarker profiling compared to intracellular and cell-free blood. J Extracell Vesicles. 2014;3(1):23743.
Not in our library10.3402/jev.v3.23743 (opens in a new tab)
- 14.
Williams KC, Renthal NE, Gerard RD, Mendelson CR The microRNA (miR)-199a/214 cluster mediates opposing effects of progesterone and estrogen on uterine contractility during pregnancy and labor. Mol Endocrinol. 2012;26(11):1857–1867.
Not in our library10.1210/me.2012-1199 (opens in a new tab)
- 15.
Salomon C, Yee SW, Mitchell MD, Rice GE The possible role of extravillous trophoblast-derived exosomes on the uterine spiral arterial remodeling under both normal and pathological conditions. BioMed Res Int. 2014;2014:693157.
Not in our library10.1155/2014/693157 (opens in a new tab)
- 16.
Cuffe JSM, Holland O, Salomon C, Rice GE, Perkins AV Review: placental derived biomarkers of pregnancy disorders. Placenta. 2017;54:104–110.
Not in our library10.1016/j.placenta.2017.01.119 (opens in a new tab)
- 17.
Donker RB, Mouillet JF, Chu T, Hubel CA, Stolz DB, Morelli AE, Sadovsky Y The expression profile of C19MC microRNAs in primary human trophoblast cells and exosomes. Mol Hum Reprod. 2012;18(8):417–424.
Not in our library10.1093/molehr/gas013 (opens in a new tab)
- 18.
Salomon C, Guanzon D, Scholz-Romero K, Longo S, Correa P, Illanes SE, Rice GE Placental exosomes as early biomarker of preeclampsia: potential role of exosomal microRNAs across gestation. J Clin Endocrinol Metab. 2017;102(9):3182–3194.
Not in our library10.1210/jc.2017-00672 (opens in a new tab)
- 19.
Dixon CL, Richardson L, Sheller-Miller S, Saade G, Menon R A distinct mechanism of senescence activation in amnion epithelial cells by infection, inflammation, and oxidative stress. Am J Reprod Immunol. 2018;79(3):e12790.
Not in our library10.1111/aji.12790 (opens in a new tab)
- 20.
- 21.
- 22.
Sheller-Miller S, Urrabaz-Garza R, Saade G, Menon R Damage-associated molecular pattern markers HMGB1 and cell-free fetal telomere fragments in oxidative-stressed amnion epithelial cell-derived exosomes. J Reprod Immunol. 2017;123:3–11.
Not in our library10.1016/j.jri.2017.08.003 (opens in a new tab)
- 23.
- 24.
Friedländer MR, Chen W, Adamidi C, Maaskola J, Einspanier R, Knespel S, Rajewsky N Discovering microRNAs from deep sequencing data using miRDeep. Nat Biotechnol. 2008;26(4):407–415.
Not in our library10.1038/nbt1394 (opens in a new tab)
- 25.
Al-Khanbashi M, Caramuta S, Alajmi AM, Al-Haddabi I, Al-Riyami M, Lui WO, Al-Moundhri MS Tissue and serum miRNA profile in locally advanced breast cancer (LABC) in response to neo-adjuvant chemotherapy (NAC) treatment. PLoS One. 2016;11(4):e0152032.
Not in our library10.1371/journal.pone.0152032 (opens in a new tab)
- 26.
Creighton CJ, Benham AL, Zhu H, Khan MF, Reid JG, Nagaraja AK, Fountain MD, Dziadek O, Han D, Ma L, Kim J, Hawkins SM, Anderson ML, Matzuk MM, Gunaratne PH Discovery of novel microRNAs in female reproductive tract using next generation sequencing. PLoS One. 2010;5(3):e9637.
Not in our library10.1371/journal.pone.0009637 (opens in a new tab)
- 27.
Gao T, Deng M, Wang Q miRNA-320a inhibits trophoblast cell invasion by targeting estrogen-related receptor-gamma. J Obstet Gynaecol Res. 2018;44(4):756–763.
Not in our library10.1111/jog.13560 (opens in a new tab)
- 28.
Bogusławska J, Rodzik K, Popławski P, Kędzierska H, Rybicka B, Sokół E, Tański Z, Piekiełko-Witkowska A TGF-β1 targets a microRNA network that regulates cellular adhesion and migration in renal cancer. Cancer Lett. 2018;412:155–169.
Not in our library10.1016/j.canlet.2017.10.019 (opens in a new tab)
- 29.
Hromadnikova I, Kotlabova K, Hympanova L, Krofta L Cardiovascular and Cerebrovascular disease associated microRNAs are dysregulated in placental tissues affected with gestational hypertension, preeclampsia and intrauterine growth restriction. PLoS One. 2015;10(9):e0138383.
Not in our library10.1371/journal.pone.0138383 (opens in a new tab)
- 30.
Kouhkan F, Mobarra N, Soufi-Zomorrod M, Keramati F, Hosseini Rad SM, Fathi-Roudsari M, Tavakoli R, Hajarizadeh A, Ziaei S, Lahmi R, Hanif H, Soleimani M MicroRNA-129-1 acts as tumour suppressor and induces cell cycle arrest of GBM cancer cells through targeting IGF2BP3 and MAPK1. J Med Genet. 2016;53(1):24–33.
Not in our library10.1136/jmedgenet-2015-103225 (opens in a new tab)
- 31.
Hromadnikova I, Kotlabova K, Hympanova L, Krofta L Gestational hypertension, preeclampsia and intrauterine growth restriction induce dysregulation of cardiovascular and cerebrovascular disease associated microRNAs in maternal whole peripheral blood. Thromb Res. 2016;137:126–140.
Not in our library10.1016/j.thromres.2015.11.032 (opens in a new tab)
- 32.
Kuo WT, Yu SY, Li SC, Lam HC, Chang HT, Chen WS, Yeh CY, Hung SF, Liu TC, Wu T, Yu CC, Tsai KW MicroRNA-324 in human cancer: miR-324-5p and miR-324-3p have distinct biological functions in human cancer. Anticancer Res. 2016;36(10):5189–5196.
Not in our library10.21873/anticanres.11089 (opens in a new tab)
- 33.
Wu CX, Cheng J, Wang YY, Wang JJ, Guo H, Sun H MicroRNA expression profiling of macrophage line RAW264.7 infected by Candida albicans. Shock. 2017;47(4):520–530.
Not in our library10.1097/shk.0000000000000766 (opens in a new tab)
- 34.
Machtinger R, Rodosthenous RS, Adir M, Mansour A, Racowsky C, Baccarelli AA, Hauser R Extracellular microRNAs in follicular fluid and their potential association with oocyte fertilization and embryo quality: an exploratory study. J Assist Reprod Genet. 2017;34(4):525–533.
Not in our library10.1007/s10815-017-0876-8 (opens in a new tab)
- 35.
Nawshad A, Lagamba D, Polad A, Hay ED Transforming growth factor-β signaling during epithelial-mesenchymal transformation: implications for embryogenesis and tumor metastasis. Cells Tissues Organs. 2005;179(1–2):11–23.
Not in our library10.1159/000084505 (opens in a new tab)
- 36.
Forbes K, Souquet B, Garside R, Aplin JD, Westwood M Transforming growth factor-β (TGFβ) receptors I/II differentially regulate TGFβ1 and IGF-binding protein-3 mitogenic effects in the human placenta. Endocrinology. 2010;151(4):1723–1731.
Not in our library10.1210/en.2009-0896 (opens in a new tab)
- 37.
Cheng JC, Chang HM, Fang L, Sun YP, Leung PC TGF-β1 up-regulates connexin43 expression: a potential mechanism for human trophoblast cell differentiation. J Cell Physiol. 2015;230(7):1558–1566.
Not in our library10.1002/jcp.24902 (opens in a new tab)
- 38.
Zhang Z, Huang L, Yu Z, Chen X, Yang D, Zhan P, Dai M, Huang S, Han Z, Cao K Let-7a functions as a tumor suppressor in Ewing’s sarcoma cell lines partly by targeting cyclin-dependent kinase 6. DNA Cell Biol. 2014;33(3):136–147.
Not in our library10.1089/dna.2013.2179 (opens in a new tab)
- 39.
Xu C, Sun X, Qin S, Wang H, Zheng Z, Xu S, Luo G, Liu P, Liu J, Du N, Zhang Y, Liu D, Ren H Let-7a regulates mammosphere formation capacity through Ras/NF-κB and Ras/MAPK/ERK pathway in breast cancer stem cells. Cell Cycle. 2015;14(11):1686–1697.
Not in our library10.1080/15384101.2015.1030547 (opens in a new tab)
- 40.
Liu Y, Miao L, Ni R, Zhang H, Li L, Wang X, Li X, Wang J MicroRNA-520a-3p inhibits proliferation and cancer stem cell phenotype by targeting HOXD8 in non-small cell lung cancer. Oncol Rep. 2016;36(6):3529–3535.
Not in our library10.3892/or.2016.5149 (opens in a new tab)
Cited by papers we hold1
Reads
Read by people on this page
None yet.
Checked or read by AI through naulon
None yet.
A person counts once a day per paper. We keep no cookie and no address: a reader is a hash that changes every day. Any month under five reads shows no number.
Are you an author?
Is this your paper?
Claim it to add your note and be paid when agents cite it. Free.