Small extracellular vesicles containing arginase-1 suppress T-cell responses and promote tumor growth in ovarian carcinoma
Malgorzata Czystowska-Kuzmicz, Anna Sosnowska, Dominika Nowis and 20 more
Nature Communications · 2019 · CC BY
doi:10.1038/s41467-019-10979-3 (opens in a new tab)
We email you when a new notice or a question about this paper appears.
Abstract
Tumor-driven immune suppression is a major barrier to successful immunotherapy in ovarian carcinomas (OvCa). Among various mechanisms responsible for immune suppression, arginase-1 (ARG1)-carrying small extracellular vesicles (EVs) emerge as important contributors to tumor growth and tumor escape from the host immune system. Here, we report that small EVs found in the ascites and plasma of OvCa patients contain ARG1. EVs suppress proliferation of CD4 + and CD8 + T-cells in vitro and in vivo in OvCa mouse models. In mice, ARG1-containing EVs are transported to draining lymph nodes, taken up by dendritic cells and inhibit antigen-specific T-cell proliferation. Increased expression of ARG1 in mouse OvCa cells is associated with accelerated tumor progression that can be blocked by an arginase inhibitor. Altogether, our studies show that tumor cells use EVs as vehicles to carry over long distances and deliver to immune cells a metabolic checkpoint molecule – ARG1, mitigating anti-tumor immune responses.
Figures7
From PubMed Central, U.S. National Library of Medicine.
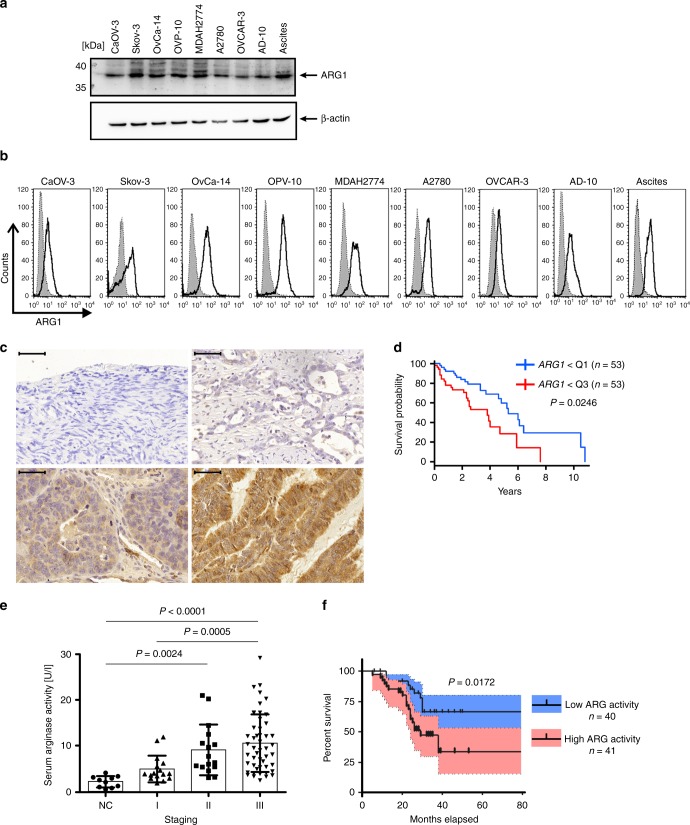
Fig. 1
Full legend
ARG1 is expressed in ovarian tumors and its levels correlate with poor prognosis. a, b ARG1 expression in OvCa cell lines and tumor cells obtained from ascites determined by Western blotting and flow cytometry, respectively. The shaded area (in b) represents isotype control staining, whereas the transparent one reflects ARG1 expression. c Representative immunohistochemistry staining of ARG1 in normal ovary (upper left) and ovarian tumor (upper right and lower panels) sections at diagnosis (bar = 50 µm). Images represent no (i), weak (ii), moderate (iii), and strong (iv) staining intensity for ARG1. d Kaplan–Meier curve showing higher survival probability for n = 53 patients demonstrating low ARG1 transcript levels (lower quartile Q1) as compared to n = 53 patients with elevated (upper quartile Q3) expression levels of the gene. P = 0.0246 has been computed with the Cox proportional hazards model with age, clinical stage, and tumor grade included in the analysis. e Arginase activity in plasma of n = 81 OvCa (staging I–III) patients at the time of diagnosis and of 10 healthy controls (NC) determined in a colorimetric assay. Data show means ± standard deviation (SD), *P = 0.0024; **P = 0.0005; ***P < 0.0001, Kruskal–Wallis test with Dunn’s multiple comparison test. For every patient the mean activity of three independent measurements is shown. f Percent survival of n = 81 OvCa patients with high plasma arginase activity (two upper quartiles, pink) and low plasma arginase activity (two lower quartiles, blue). P = 0.0172 high (≥7.5 U ml−1) vs. low (<7.5 U ml−1) ARG activity, log-rank test, blue/pink shading −95% confidence interval. Source data for panels a and e are provided as a Source Data file
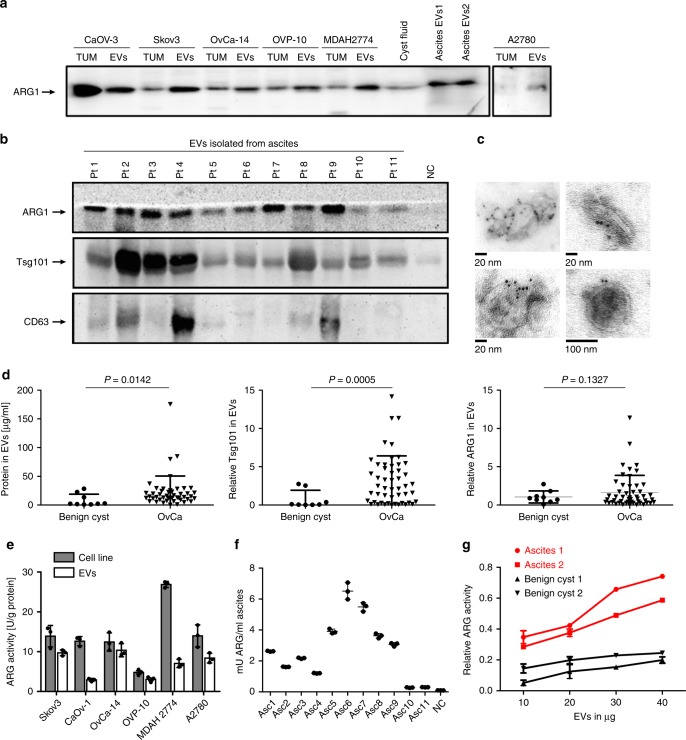
Fig. 2
Full legend
OvCa-derived EVs contain enzymatically active ARG1. a ARG1 content in EVs and the parental OvCa cell lines lysates (TUM) as well as in EVs isolated from the cyst fluid and ascites fluid of two OvCa patients (EV1, EV2) determined by Western blotting. Equal amounts of protein (30 μg) were loaded per lane. b Representative Western blot for ARG1 and typical exosomal markers in EVs isolated from ascites of n = 11 OvCa patients. EVs isolated from ovarian fluid served as normal control (NC). Equal amounts of protein (30 μg) were loaded per lane. c Representative TEM images of whole-mounted OvCa patient-derived tEVs. Dots indicate immunogold (6 nm gold particles) labeling of ARG1. d Protein concentration measured with BCA assay, Tsg101 and ARG1 levels in EVs isolated from 2 ml of ascites of OvCa patients (n = 47–50) and from 2 ml of benign cysts fluid (n = 7–9). Relative Tsg101 and ARG1 content was determined by densitometric analysis of Western blots. Data refers to means ± SD, P values were calculated with unpaired t-test with Welch’s correction. e Arginase activity in OvCa cell line lysates and in the corresponding EVs determined by measuring ʟ-arginine conversion to urea in a colorimetric assay. Data show means ± SD, n = 3. f Arginase activity in EVs isolated from n = 11 OvCa patients’ ascites (Asc) and benign cyst fluid (NC) calculated per ml of starting fluid volume. Data show means ± SD, n = 3. g Arginase activity as a function of amount of EVs in n = 2 OvCa patients ascites-isolated tEVs and EVs isolated from n = 2 benign cyst fluid. Data show means ± SD. Source data for data in panels a, b, d–g are provided as a Source Data file
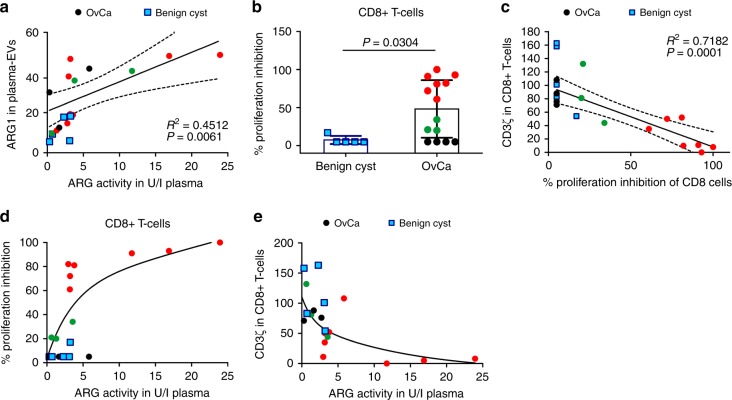
Fig. 3
Full legend
ARG1-containing EVs contribute to systemic immune suppression in OvCa patients. a Correlation of relative expression of ARG1 in plasma-derived EVs (isolated from n = 14 OvCa patients [circles] and n = 5 patients with benign cyst of the ovary [squares]) and plasma ARG activity. R2 value and P values calculated with GraphPad Prism 6.0. Dotted lines mark 95% confidence intervals. b–e Black circles mark OvCa samples with no CD8+ T-cell proliferation inhibition (n = 4), green circles (n = 3)—moderate proliferation inhibition, and red circles (n = 7)—complete or nearly complete proliferation inhibition. Blue squares mark benign cyst samples. b Proliferation of peripheral blood CD8+ T-cells in n = 14 OvCa patients and n = 5 patients with benign ovarian cyst normalized to the mean proliferation of n = 5 healthy controls. Data show means ± SD, P-value calculated with Mann–Whitney U-test. c Correlation of the peripheral blood CD8+ T cell percentage of proliferation inhibition and CD3ζ levels evaluated in flow cytometry. R2 value and P value calculated with GraphPad Prism 6.0. Dotted lines mark 95% confidence intervals. d Percentages of peripheral blood CD8+ cells proliferation inhibition as a function of ARG activity in plasma of n = 14 OvCa patients and n = 5 patients with benign cyst of the ovary. e CD3ζ levels evaluated in flow cytometry as a function of ARG activity in the plasma of n = 14 OvCa patients and n = 5 patients with benign cyst of the ovary. Source data are provided as a Source Data file
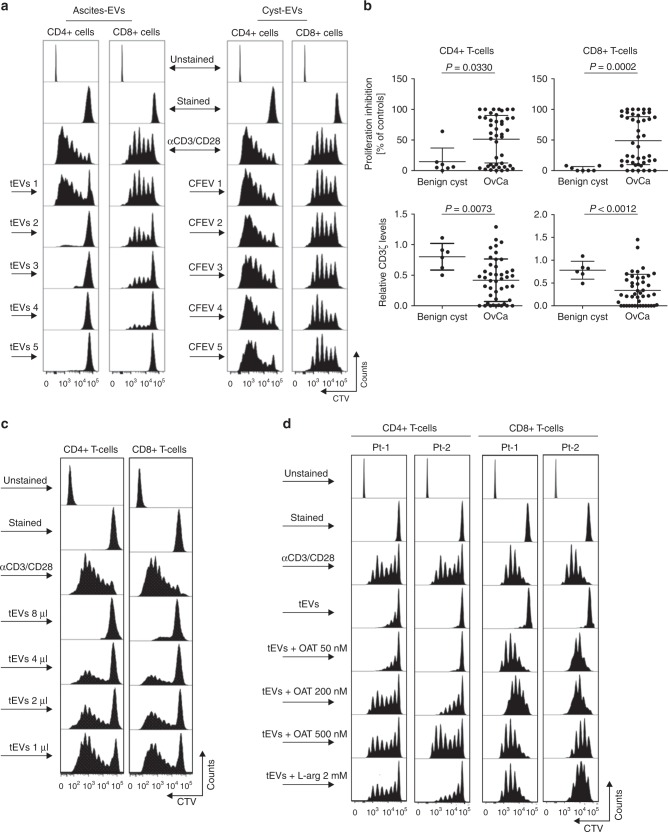
Fig. 4
Full legend
EV-ARG1 is involved in the suppression of T-cell proliferation in vitro. a Representative proliferation histograms of αCD3/αCD28-stimulated CD8+ and CD4+ T cells incubated for 6 days with tumor ascites-derived EVs isolated from n = 5 OvCa patients (left panel, tEVs 1–5) and control EVs (CFEV1–5, right panel), isolated from n = 5 patients with benign cyst of the ovary. b Inhibition of proliferation (upper) and decrease in CD3ζ levels (lower) of peripheral blood CD4+ (left) or CD8+ T-cells (right) by OvCa ascitic fluid-isolated EVs (n = 43–44). Data show means ± SD, P values for OvCa ascites vs. benign cyst fluid-isolated EVs treated group (n = 6–7) were calculated with Mann–Whitney U-test. The amount of added EVs corresponded to 2 ml of starting material a, b. c Representative proliferation histograms of αCD3/αCD28-stimulated CD4+ and CD8+ T-cells incubated with increasing amounts of tEVs, isolated from 2 ml (8 µl), 1 ml (4 µl), 0.5 ml (2 µl), or 0.25 ml (1 µl) of ascites, respectively. d Representative proliferation histograms of peripheral blood CD4+ and CD8+ T-cells incubated for 6 days with tEVs (corresponding to 2 ml of ascites) and indicated concentrations of an arginase inhibitor, OAT-1746. Cells incubated for 6 days with tEVs and 2 mM ʟ-arginine served as a positive control for ʟ-arginine-dependent reversal of T-cells proliferation inhibition. Source data for panel b are provided as a Source Data file
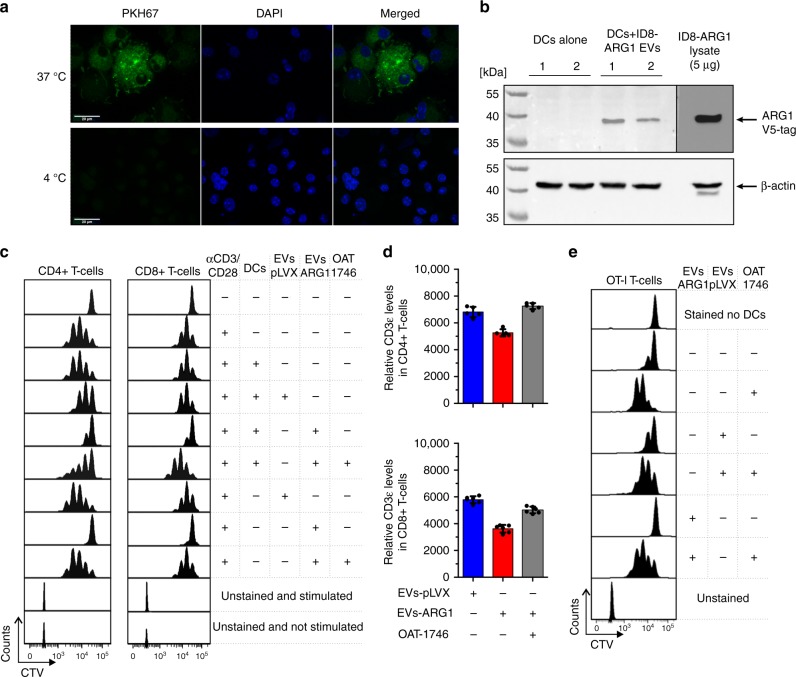
Fig. 5
Full legend
ARG1-EVs are internalized by murine bone marrow-derived DCs (BMDCs) and block DCs-primed T-cell proliferation. a Representative image of EVs endocytosed by BMDCs from confocal microscopy. BMDCs were incubated with 50 µg of PKH-67-stained ARG1-EVs isolated from the supernatants of ID8-ARG1-V5 murine ovarian carcinoma cell line for 4 h in 37 or 4 °C (inhibited internalization, negative control), washed and fixed. Green—PKH67-stained EVs, blue—DAPI nuclear stain. b Western blotting for V5-tag labeled ARG1 in DCs lysates. BMDCs were incubated with 50 µg of ARG1-EVs isolated from supernatants of ID8-ARG1-V5 murine OvCa cell line for 4 h in 37 °C, washed and lysed. ID8-ARG1-V5 (ID8-ARG1) cells lysate was used as a positive control for V5-tagged Arg1 detection. Beta-actin served as equal protein loading control. c Representative proliferation histograms of αCD3/αCD28-stimulated CD4+ and CD8+ T-cells co-cultured with BMDCs pre-incubated with 100 µg EVs isolated from the supernatants of ID8-ARG1 cells (EVs-ARG1) or ID8-pLVX (EVs-pLVX) cells for 3 days. EVs-ARG1 or EVs-pLVX with no BMDCs and/or ARG inhibitor OAT-1746 (200 nM) were added to some groups as indicated in the figure. d Relative CD3ε expression evaluated with flow cytometry in αCD3/αCD28-stimulated CD4+ (upper graph) and CD8+ (lower graph) T-cells after pre-incubation with EVs-ARG1 or EVs-pLVX (90 µg) and/or ARG inhibitor OAT-1746 (400 nM). Data show MFI of two technical repeats from n = 3 mice ± SD. e Representative proliferation histograms of SIINFEKL-specific CD8+ T-cells (OT-I T-cells) primed with SIINFEKL peptide pulsed BMDCs. Where indicated, DCs were pre-incubated with EVs-ARG1 or EVs-pLVX (100 µg) in the presence of 200 nM ARG inhibitor OAT-1746. Source data for panels b and d are provided as a Source Data file
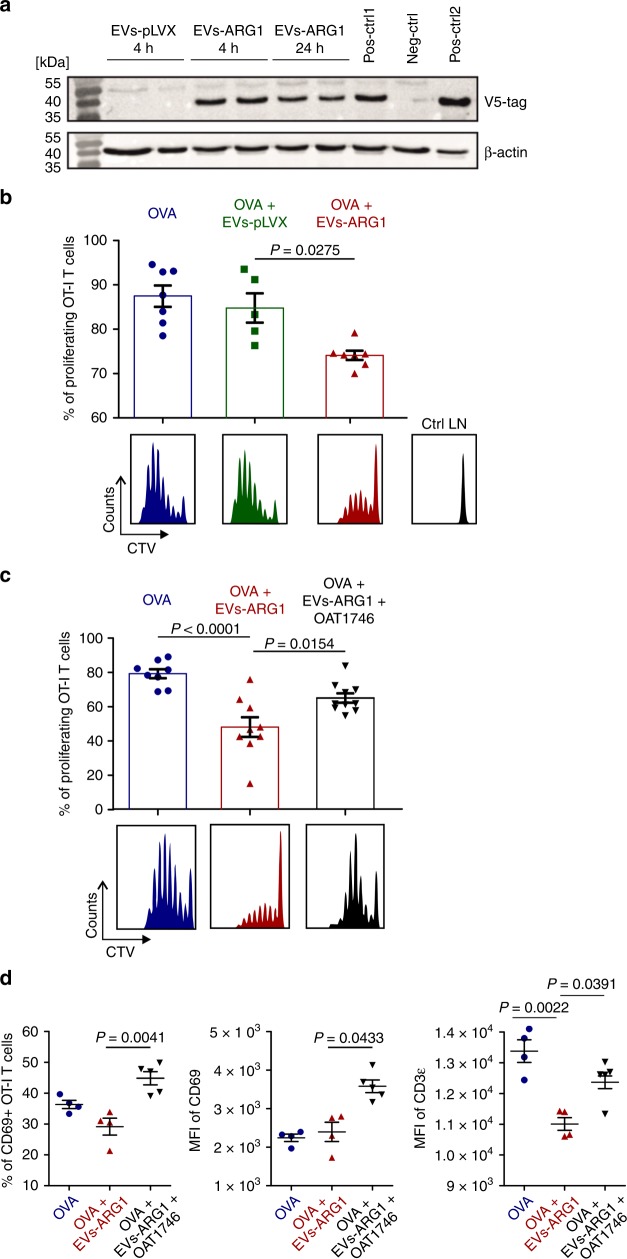
Fig. 6
Full legend
Subcutaneously administered EVs transfer ARG1 to local lymph nodes and block OVA-antigen-specific T-cell proliferation. a Right inguinal lymph nodes from C57BL/6 mice were collected 4 or 24 h post EVs (250 µg) or PBS (Neg-ctrl) inoculation, lysed, and analyzed with immunoblotting for V5 tag. Pos-ctrl1: lysate of control lymph node with ex vivo added EVs-ARG1. Pos-ctrl2: lysate from ID8-ARG1-V5 cells. β-actin served as equal protein loading control. b–d OVA-specific, CTV-stained OT-I T-cells were injected i.v. into C57BL/6 mice and 24 h post adoptive transfer 5 μg of OVA protein 100 μg of EVs were injected daily for the consecutive 3 days s.c. into the right thigh. Where indicated, mice received 20 mg/kg of ARG inhibitor (OAT-1746) i.p. twice a day for the 3 following days. Each experimental group consisted of n = 4–9 mice. After 72 h CD8+ T-cells were isolated from right and left (control) inguinal lymph nodes, stained with SIINFEKL-H-2Kb tetramers and analyzed for proliferation. b Percentages (upper graph) and exemplary histograms (lower panel) of proliferating OT-I T cells isolated from mice immunized with ovalbumin (OVA) and injected with control EVs-pLVX or EVs-ARG1 EVs. T-cells isolated from the contralateral lymph node served as negative control (Ctrl LN). Representative experiment out of n = 2 is shown, data show means ± SD, P value was calculated with Kruskal–Wallis with Dunn’s multiple comparison test. c Percentages (upper) and exemplary histograms (lower panel) of proliferating OT-I T cells isolated from mice immunized with OVA and injected with EVs-ARG1 and/or ARG inhibitor OAT-1746. Representative experiment out of n = 2 with similar results is shown, data show means ± SD, P values were calculated with one-way ANOVA with Bonferroni post-hoc test. d Percentages of CD69+ T-cells (left), mean fluorescence intensity (MFI) for CD69 staining (middle) and MFI for CD3ε staining in OT-I T cells isolated from mice immunized with OVA and injected with EVs-ARG1 and/or ARG inhibitor OAT-1746. Representative experiment out of n = 2 is shown. Data show means ± SD, P values were calculated with Kruskal–Wallis with Dunn’s multiple comparison test. Source data for panels b–d are provided as a Source Data file
Show all 7 figures
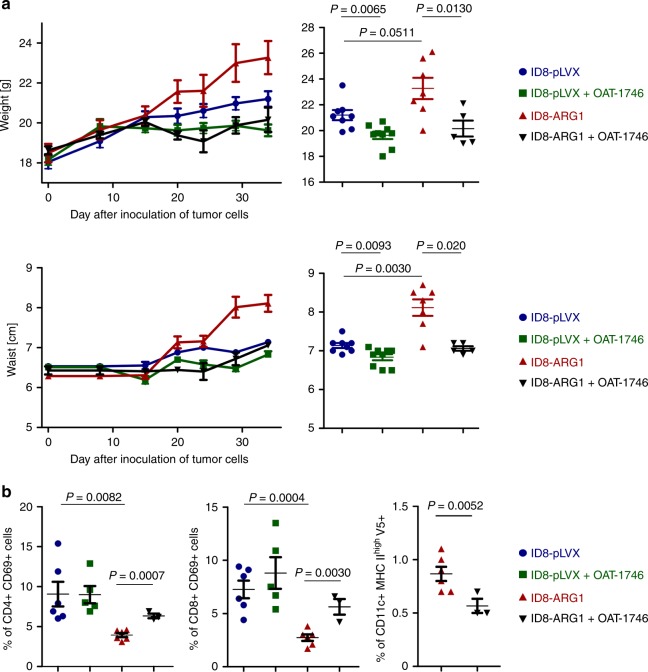
Fig. 7
Full legend
ARG1 promotes tumor growth in vivo. C57BL/6 mice were inoculated i.p. with 4 × 10⁶ ID8-VegfA/Defb29 cells transduced with V5-tagged murine ARG1 (ID8-ARG1-V5) or the control vector (ID8-pLVX). a Mice were treated from day 14th after tumor inoculation with OAT-1746 or PBS i.p. twice daily and monitored for tumor development until first mice met the humane endpoint criteria described in the “Methods” section. Increase in mice weight (upper left) and waist circumference (lower left) in time compared to day 0 (day of tumor cells i.p. inoculation) as a measure of ovarian cancer progression/ascites development. Measurements of gained weight (upper right) and percentage of gained waist circumference (lower right) on day 34 after inoculation of tumor cells. Each experimental group consisted of n = 5–9 mice. Data show means ± SE. b Mice were treated from day 14th after tumor inoculation with OAT-1746 ARG inhibitor or PBS i.p. twice daily for consecutive 2 weeks. After 2 weeks of treatment cells from ascites were isolated and analyzed by flow cytometry. Percentage of ascitic activated (identified as CD69+) CD4+ (left panel) or CD8+ T-cells (middle panel), as well as percentage of activated (MHCIIhigh) CD11c+ DCs positive for V5-tag (right panel) on day 28th after inoculation of tumor cells. Each experimental group consisted of n = 3–6 mice. Data show means ± SD; P values were calculated with unpaired t-test. Source data are provided as a Source Data file
References66
- 1.
Coburn SB, Bray F, Sherman ME, Trabert B. International patterns and trends in ovarian cancer incidence, overall and by histologic subtype. Int. J. Cancer. 2017;140:2451-2460.
Not in our library10.1002/ijc.30676 (opens in a new tab)
- 2.
Tewari KS, Java JJ, Eskander RN, Monk BJ, Burger RA. Early initiation of chemotherapy following complete resection of advanced ovarian cancer associated with improved survival: NRG Oncology/Gynecologic Oncology Group study. Ann. Oncol. 2016;27:114-121.
Not in our library10.1093/annonc/mdv500 (opens in a new tab)
- 3.
International Collaborative Ovarian Neoplasm, G. Paclitaxel plus carboplatin versus standard chemotherapy with either single-agent carboplatin or cyclophosphamide, doxorubicin, and cisplatin in women with ovarian cancer: the ICON3 randomised trial. Lancet360, 505–515 (2002).
Not in our library10.1016/s0140-6736(02)09738-6 (opens in a new tab)
- 4.
Hung CF, Wu TC, Monie A, Roden R. Antigen-specific immunotherapy of cervical and ovarian cancer. Immunol. Rev. 2008;222:43-69.
Not in our library10.1111/j.1600-065x.2008.00622.x (opens in a new tab)
- 5.
Alipour S, et al. Specific immunotherapy in ovarian cancer: a systematic review. Immunotherapy. 2016;8:1193-1204.
Not in our library10.2217/imt-2016-0034 (opens in a new tab)
- 6.
Mittica G, et al. Adoptive immunotherapy against ovarian cancer. J. Ovarian Res. 2016;9:30.
Not in our library10.1186/s13048-016-0236-9 (opens in a new tab)
- 7.
Kandalaft LE, Motz GT, Duraiswamy J, Coukos G. Tumor immune surveillance and ovarian cancer: lessons on immune mediated tumor rejection or tolerance. Cancer Metastas. Rev. 2011;30:141-151.
Not in our library10.1007/s10555-011-9289-9 (opens in a new tab)
- 8.
Whiteside TL. Tricks tumors use to escape from immune control. Oral Oncol. 2009;45:e119-e123.
Not in our library10.1016/j.oraloncology.2009.03.006 (opens in a new tab)
- 9.
Han LY, et al. HLA class I antigen processing machinery component expression and intratumoral T-cell infiltrate as independent prognostic markers in ovarian carcinoma. Clin. Cancer Res. 2008;14:3372-3379.
Not in our library10.1158/1078-0432.ccr-07-4433 (opens in a new tab)
- 10.
Dietl J, Engel JB, Wischhusen J. The role of regulatory T cells in ovarian cancer. Int. J. Gynecol. Cancer. 2007;17:764-770.
Not in our library10.1111/j.1525-1438.2006.00861.x (opens in a new tab)
- 11.
Kryczek I, et al. B7-H4 expression identifies a novel suppressive macrophage population in human ovarian carcinoma. J. Exp. Med. 2006;203:871-881.
Not in our library10.1084/jem.20050930 (opens in a new tab)
- 12.
Yigit R, Massuger LF, Figdor CG, Torensma R. Ovarian cancer creates a suppressive microenvironment to escape immune elimination. Gynecol. Oncol. 2010;117:366-372.
Not in our library10.1016/j.ygyno.2010.01.019 (opens in a new tab)
- 13.
Maj T, et al. Oxidative stress controls regulatory T cell apoptosis and suppressor activity and PD-L1-blockade resistance in tumor. Nat. Immunol. 2017;18:1332-1341.
Not in our library10.1038/ni.3868 (opens in a new tab)
- 14.
Singer K, Gottfried E, Kreutz M, Mackensen A. Suppression of T-cell responses by tumor metabolites. Cancer Immunol. Immunother. 2011;60:425-431.
Not in our library10.1007/s00262-010-0967-1 (opens in a new tab)
- 15.
Rodriguez PC, et al. Regulation of T cell receptor CD3zeta chain expression by L-arginine. J. Biol. Chem. 2002;277:21123-21129.
Not in our library10.1074/jbc.m110675200 (opens in a new tab)
- 16.
Rodriguez PC, et al. Arginase I production in the tumor microenvironment by mature myeloid cells inhibits T-cell receptor expression and antigen-specific T-cell responses. Cancer Res. 2004;64:5839-5849.
Not in our library10.1158/0008-5472.can-04-0465 (opens in a new tab)
- 17.
Van de Velde LA, et al. T cells encountering myeloid cells programmed for amino acid-dependent immunosuppression use Rictor/mTORC2 protein for proliferative checkpoint decisions. J. Biol. Chem. 2017;292:15-30.
Not in our library10.1074/jbc.m116.766238 (opens in a new tab)
- 18.
Modolell M, et al. Local suppression of T cell responses by arginase-induced L-arginine depletion in nonhealing leishmaniasis. PLoS Negl. Trop. Dis. 2009;3:e480.
Not in our library10.1371/journal.pntd.0000480 (opens in a new tab)
- 19.
Narita Y, et al. The key role of IL-6-arginase cascade for inducing dendritic cell-dependent CD4(+) T cell dysfunction in tumor-bearing mice. J. Immunol. 2013;190:812-820.
Not in our library10.4049/jimmunol.1103797 (opens in a new tab)
- 20.
Munder M. Arginase: an emerging key player in the mammalian immune system. Br. J. Pharm. 2009;158:638-651.
Not in our library10.1111/j.1476-5381.2009.00291.x (opens in a new tab)
- 21.
de Boniface J, Mao Y, Schmidt-Mende J, Kiessling R, Poschke I. Expression patterns of the immunomodulatory enzyme arginase 1 in blood, lymph nodes and tumor tissue of early-stage breast cancer patients. Oncoimmunology. 2012;1:1305-1312.
Not in our library10.4161/onci.21678 (opens in a new tab)
- 22.
Suer Gokmen S, Yoruk Y, Cakir E, Yorulmaz F, Gulen S. Arginase and ornithine, as markers in human non-small cell lung carcinoma. Cancer Biochem. Biophys. 1999;17:125-131.
Not in our library
- 23.
Bron L, et al. Prognostic value of arginase-II expression and regulatory T-cell infiltration in head and neck squamous cell carcinoma. Int. J. Cancer. 2013;132:E85-E93.
Not in our library10.1002/ijc.27728 (opens in a new tab)
- 24.
Ochoa AC, Zea AH, Hernandez C, Rodriguez PC. Arginase, prostaglandins, and myeloid-derived suppressor cells in renal cell carcinoma. Clin. Cancer Res. 2007;13:721s-726s.
Not in our library10.1158/1078-0432.ccr-06-2197 (opens in a new tab)
- 25.
Grabon W, Mielczarek-Puta M, Chrzanowska A, Baranczyk-Kuzma A. l-arginine as a factor increasing arginase significance in diagnosis of primary and metastatic colorectal cancer. Clin. Biochem. 2009;42:353-357.
Not in our library10.1016/j.clinbiochem.2008.11.018 (opens in a new tab)
- 26.
Gokmen SS, Aygit AC, Ayhan MS, Yorulmaz F, Gulen S. Significance of arginase and ornithine in malignant tumors of the human skin. J. Lab. Clin. Med. 2001;137:340-344.
Not in our library10.1067/mlc.2001.114543 (opens in a new tab)
- 27.
Bedoya AM, et al. Immunosuppression in cervical cancer with special reference to arginase activity. Gynecol. Oncol. 2014;135:74-80.
Not in our library10.1016/j.ygyno.2014.07.096 (opens in a new tab)
- 28.
Raber P, Ochoa AC, Rodriguez PC. Metabolism of L-arginine by myeloid-derived suppressor cells in cancer: mechanisms of T cell suppression and therapeutic perspectives. Immunol. Invest. 2012;41:614-634.
Not in our library10.3109/08820139.2012.680634 (opens in a new tab)
- 29.
Gannon PO, et al. Androgen-regulated expression of arginase 1, arginase 2 and interleukin-8 in human prostate cancer. PLoS One. 2010;5:e12107.
Not in our library10.1371/journal.pone.0012107 (opens in a new tab)
- 30.
Mussai F, et al. Neuroblastoma arginase activity creates an immunosuppressive microenvironment that impairs autologous and engineered immunity. Cancer Res. 2015;75:3043-3053.
Not in our library10.1158/0008-5472.can-14-3443 (opens in a new tab)
- 31.
Mussai F, et al. Acute myeloid leukemia creates an arginase-dependent immunosuppressive microenvironment. Blood. 2013;122:749-758.
Not in our library10.1182/blood-2013-01-480129 (opens in a new tab)
- 32.
Shenoy GN, et al. Exosomes associated with human ovarian tumors harbor a reversible checkpoint of T-cell responses. Cancer Immunol. Res. 2018;6:236-247.
Not in our library10.1158/2326-6066.cir-17-0113 (opens in a new tab)
- 33.
Taylor DD, Gercel-Taylor C, Lyons KS, Stanson J, Whiteside TL. T-cell apoptosis and suppression of T-cell receptor/CD3-zeta by Fas ligand-containing membrane vesicles shed from ovarian tumors. Clin. Cancer Res. 2003;9:5113-5119.
Not in our library
- 34.
Lea, J. et al. Detection of phosphatidylserine-positive exosomes as a diagnostic marker for ovarian malignancies: a proof of concept study. Oncotarget8, 14395–14407 (2017).
Not in our library10.18632/oncotarget.14795 (opens in a new tab)
- 35.
Whiteside TL. Exosomes in cancer: another mechanism of tumor-induced immune suppression. Adv. Exp. Med. Biol. 2017;1036:81-89.
Not in our library10.1007/978-3-319-67577-0_6 (opens in a new tab)
- 36.
Kowal J, et al. Proteomic comparison defines novel markers to characterize heterogeneous populations of extracellular vesicle subtypes. Proc. Natl Acad. Sci. USA. 2016;113:E968-E977.
Not in our library10.1073/pnas.1521230113 (opens in a new tab)
- 37.
Stanczak, P. S. et al. Development of OAT-1746, a novel arginase 1 and 2 inhibitor for cancer immunotherapy. Ann. Oncol.28, 1180P (2017) 10.1093/annonc/mdx376.045.
Not in our library
- 38.
- 39.
- 40.
Bak SP, Alonso A, Turk MJ, Berwin B. Murine ovarian cancer vascular leukocytes require arginase-1 activity for T cell suppression. Mol. Immunol. 2008;46:258-268.
Not in our library10.1016/j.molimm.2008.08.266 (opens in a new tab)
- 41.
Nishio H, et al. Immunosuppression through constitutively activated NF-kappaB signalling in human ovarian cancer and its reversal by an NF-kappaB inhibitor. Br. J. Cancer. 2014;110:2965-2974.
Not in our library10.1038/bjc.2014.251 (opens in a new tab)
- 42.
Coosemans A, et al. Immunosuppressive parameters in serum of ovarian cancer patients change during the disease course. Oncoimmunology. 2016;5:e1111505.
Not in our library10.1080/2162402x.2015.1111505 (opens in a new tab)
- 43.
Mizoguchi H, et al. Alterations in signal transduction molecules in T lymphocytes from tumor-bearing mice. Science. 1992;258:1795-1798.
Not in our library10.1126/science.1465616 (opens in a new tab)
- 44.
Krishnan S, et al. Generation and biochemical analysis of human effector CD4 T cells: alterations in tyrosine phosphorylation and loss of CD3zeta expression. Blood. 2001;97:3851-3859.
Not in our library10.1182/blood.v97.12.3851 (opens in a new tab)
- 45.
Rodriguez PC, Quiceno DG, Ochoa AC. L-arginine availability regulates T-lymphocyte cell-cycle progression. Blood. 2007;109:1568-1573.
Not in our library10.1182/blood-2006-06-031856 (opens in a new tab)
- 46.
Lai P, et al. Alterations in expression and function of signal-transducing proteins in tumor-associated T and natural killer cells in patients with ovarian carcinoma. Clin. Cancer Res. 1996;2:161-173.
Not in our library
- 47.
Klink M, Kielbik M, Nowak M, Bednarska K, Sulowska Z. JAK3, STAT3 and CD3-zeta signaling proteins status in regard to the lymphocytes function in patients with ovarian cancer. Immunol. Invest. 2012;41:382-398.
Not in our library10.3109/08820139.2011.640376 (opens in a new tab)
- 48.
Upreti D, Zhang ML, Bykova E, Kung SK, Pathak KA. Change in CD3zeta-chain expression is an independent predictor of disease status in head and neck cancer patients. Int. J. Cancer. 2016;139:122-129.
Not in our library10.1002/ijc.30046 (opens in a new tab)
- 49.
Gruber IV, et al. Down-regulation of CD28, TCR-zeta (zeta) and up-regulation of FAS in peripheral cytotoxic T-cells of primary breast cancer patients. Anticancer Res. 2008;28:779-784.
Not in our library
- 50.
Wieckowski EU, et al. Tumor-derived microvesicles promote regulatory T cell expansion and induce apoptosis in tumor-reactive activated CD8+ T lymphocytes. J. Immunol. 2009;183:3720-3730.
Not in our library10.4049/jimmunol.0900970 (opens in a new tab)
- 51.
Czystowska M, et al. IRX-2, a novel immunotherapeutic, protects human T cells from tumor-induced cell death. Cell Death Differ. 2009;16:708-718.
Not in our library10.1038/cdd.2008.197 (opens in a new tab)
- 52.
Czystowska M, et al. Mechanisms of T-cell protection from death by IRX-2: a new immunotherapeutic. Cancer Immunol. Immunother. 2011;60:495-506.
Not in our library10.1007/s00262-010-0951-9 (opens in a new tab)
- 53.
Tsui SM, et al. Pegylated derivatives of recombinant human arginase (rhArg1) for sustained in vivo activity in cancer therapy: preparation, characterization and analysis of their pharmacodynamics in vivo and in vitro and action upon hepatocellular carcinoma cell (HCC). Cancer Cell Int. 2009;9:9.
Not in our library10.1186/1475-2867-9-9 (opens in a new tab)
- 54.
Hoshino A, et al. Tumour exosome integrins determine organotropic metastasis. Nature. 2015;527:329-335.
Not in our library10.1038/nature15756 (opens in a new tab)
- 55.
Gao L, et al. Tumor-derived exosomes antagonize innate antiviral immunity. Nat. Immunol. 2018;19:233-245.
Not in our library10.1038/s41590-017-0043-5 (opens in a new tab)
- 56.
- 57.
Chen G, et al. Exosomal PD-L1 contributes to immunosuppression and is associated with anti-PD-1 response. Nature. 2018;560:382-386.
Not in our library10.1038/s41586-018-0392-8 (opens in a new tab)
- 58.
- 59.
Kim SM, et al. Cancer-derived exosomes as a delivery platform of CRISPR/Cas9 confer cancer cell tropism-dependent targeting. J. Control. Release. 2017;266:8-16.
Not in our library10.1016/j.jconrel.2017.09.013 (opens in a new tab)
- 60.
Whiteside TL. Immune modulation of T-cell and NK (natural killer) cell activities by TEXs (tumour-derived exosomes). Biochem. Soc. Trans. 2013;41:245-251.
Not in our library10.1042/bst20120265 (opens in a new tab)
- 61.
Zoller M, et al. Immunoregulatory effects of myeloid-derived suppressor cell exosomes in mouse model of autoimmune alopecia areata. Front. Immunol. 2018;9:1279.
Not in our library10.3389/fimmu.2018.01279 (opens in a new tab)
- 62.
Wang Y, et al. Exosomes released by granulocytic myeloid-derived suppressor cells attenuate DSS-induced colitis in mice. Oncotarget. 2016;7:15356-15368.
Not in our library10.18632/oncotarget.7324 (opens in a new tab)
- 63.
Zhang H, et al. Serum exosomes mediate delivery of arginase 1 as a novel mechanism for endothelial dysfunction in diabetes. Proc. Natl Acad. Sci. USA. 2018;115:E6927-E6936.
Not in our library10.1073/pnas.1721521115 (opens in a new tab)
- 64.
Royo F, et al. Hepatocyte-secreted extracellular vesicles modify blood metabolome and endothelial function by an arginase-dependent mechanism. Sci. Rep. 2017;7:42798.
Not in our library10.1038/srep42798 (opens in a new tab)
- 65.
Consortium E-T, et al. EV-TRACK: transparent reporting and centralizing knowledge in extracellular vesicle research. Nat. Methods. 2017;14:228-232.
Not in our library10.1038/nmeth.4185 (opens in a new tab)
- 66.
Cancer Genome Atlas Research N. Integrated genomic analyses of ovarian carcinoma. Nature. 2011;474:609-615.
Not in our library10.1038/nature10166 (opens in a new tab)
Cited by papers we hold17
Glioma-Derived Extracellular Vesicles – Far More Than Local Mediators · 2021
Not checked
Reads
Read by people on this page
None yet.
Checked or read by AI through naulon
None yet.
A person counts once a day per paper. We keep no cookie and no address: a reader is a hash that changes every day. Any month under five reads shows no number.
Are you an author?
Is this your paper?
Claim it to add your note and be paid when agents cite it. Free.